In our last two columns, we have explained that the Permanent Fund’s (Fund) balances would have been significantly higher, and as a result, the Legislature’s percent of market value (POMV) draws from the Fund substantially larger had the Fund invested in a proxy for the Standard and Poor’s 500 – the Vanguard S&P 500 Electronic Traded Fund (ETF) – rather than in the investment approach used by the Permanent Fund Corporation (PFC).
In those columns and our subsequent podcasts, we have criticized both the Permanent Fund Corporation (PFC), which manages the Fund, and successive Alaska Revenue commissioners, who both sit on the PFC Board and are responsible for maximizing the state’s revenues, for not shifting the Fund’s investments in that direction.
In response, some have defended both by claiming “hindsight is 20/20” and that we are engaged with our criticisms in “Monday morning quarterbacking.”
Neither is accurate.
As discussed in last week’s column, the gap between an S&P 500-based investment approach and the PFC’s has been noticeable for some time. Here are the differences in the balances and POMV draws between the two approaches over the last decade, building from a common starting point at the beginning of Fiscal Year (FY) 2013, the first year after the Vanguard S&P 500 ETF came to the market.

While the PFC might have been excused from modifying its investment approach for the first five years of the period, the differences had become noticeable by the end of FY17. At that point, using the S&P 500 ETF approach would have produced a balance of $87.91 billion, nearly 50% higher than the PFC’s.
Here is the result had the PFC shifted approaches at that point.
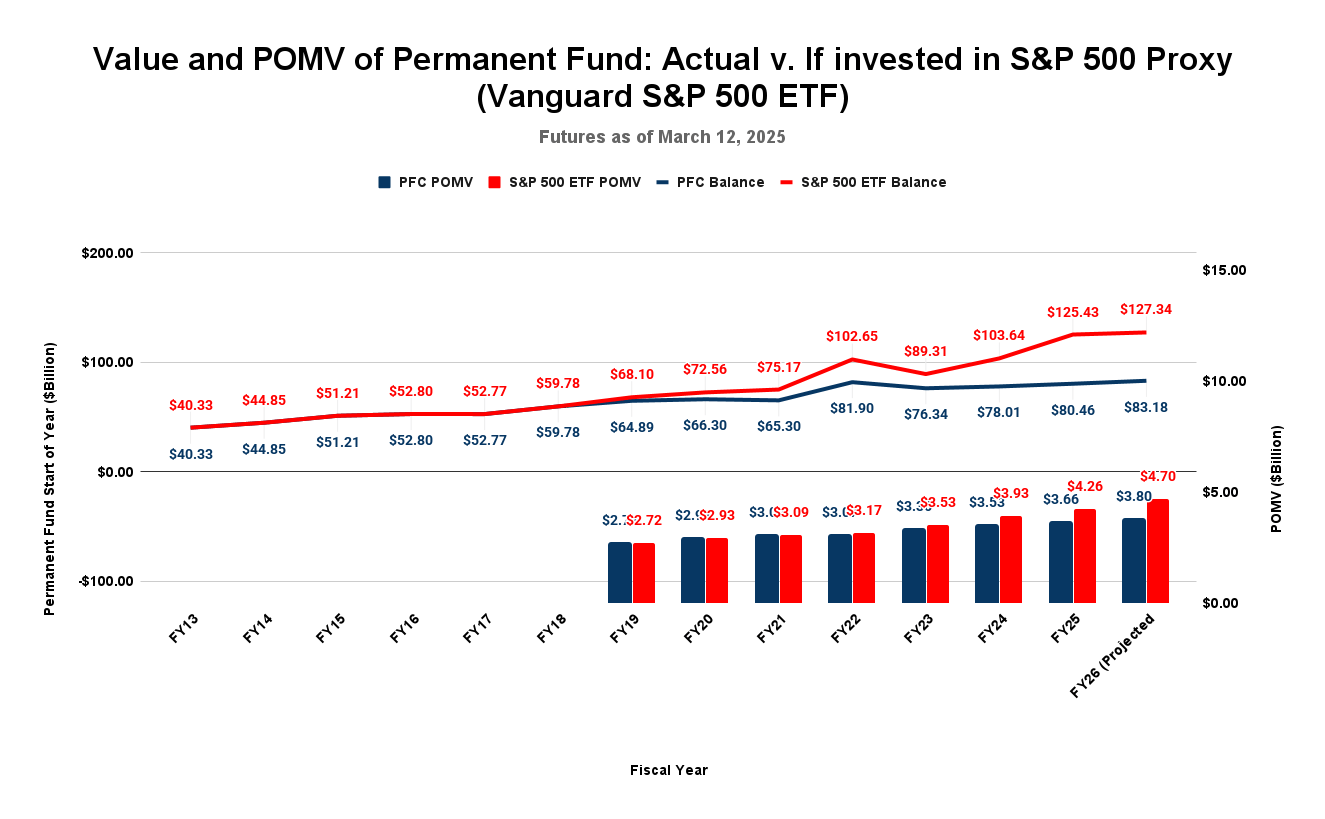
As the larger balances from the S&P 500 ETF approach began to impact the trailing five-year averages used to calculate the POMV draw, the size of the draws would have grown larger. In FY25, the current year, the POMV draw would have been $600 million higher. In FY26, the upcoming year, the POMV draw would be $900 million – nearly $1 billion – higher.
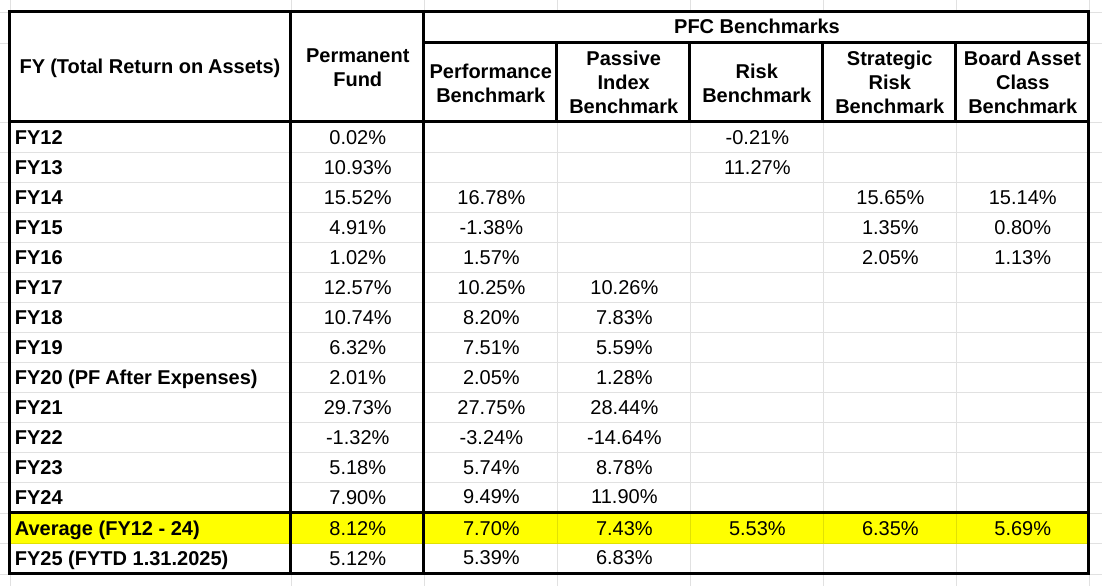
What has masked that potential for those outside the PFC – and may have masked the impact for some inside as well – are the self-created “benchmarks” the PFC has used over the period to gauge the Fund’s performance. While the benchmarks have changed from time to time, unsurprisingly given their self-created nature, the common theme throughout has been that they have generally supported the PFC’s approach.
Here are the benchmarks the PFC has used over the same thirteen-year period we used for our analysis in our previous column. While there have been variations over the years, on average over the entire period, all of the benchmarks have produced results that track relatively closely with the Fund’s actual results.
However, that view would have changed considerably had an S&P 500 ETF been added to the mix. Here is the result of adding the Vanguard S&P 500 ETF as an additional benchmark over the same period.
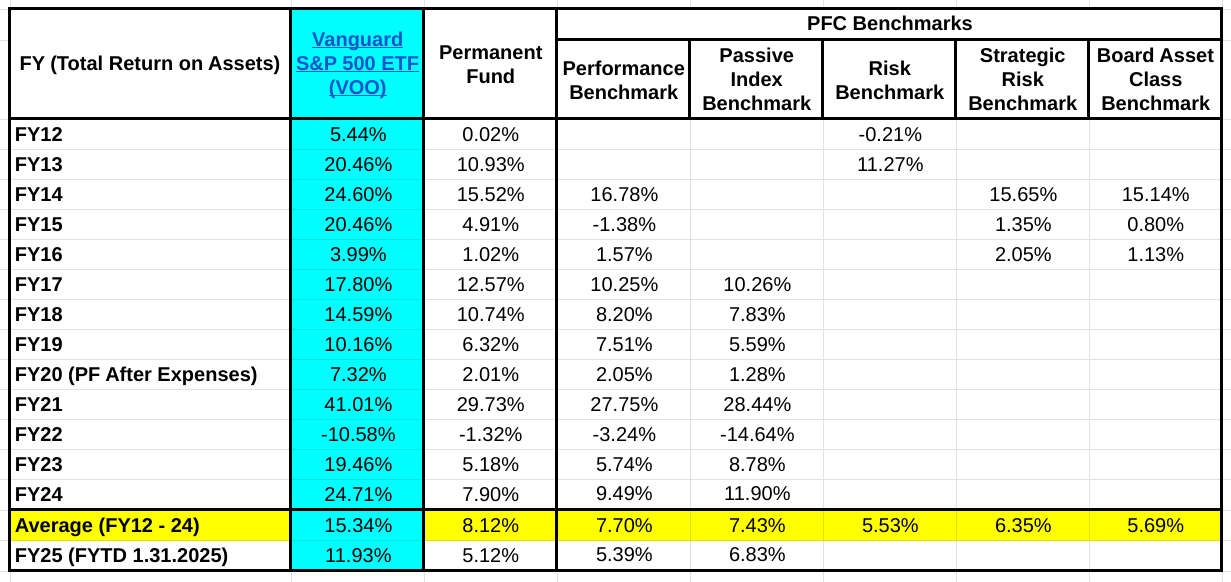
Adding that benchmark would have shown the large gap between the Fund’s returns and what it would have produced under the alternative. In every year except one (FY22), the S&P 500 ETF’s returns exceeded that of the Fund and every single one of the self-created benchmarks used to measure the PFC’s performance. The average return of the S&P 500 ETF over the period was nearly double the averages of all of the self-created benchmarks used by the PFC and almost 90% higher than that of the Fund itself.
Like others relying on the PFC’s self-generated benchmarks, historically, we had generally been unconcerned about the PFC’s administration of the Fund. While the Fund took a dip during the COVID-era financial market disruptions, so did others, and other than that, it had generally maintained an upward trajectory over time.
All that began to change for us a couple of years ago, however, while reading an article by the Alaska Beacon’s Andrew Kitchenman about the claim by the PFC’s then-Chairman, Ethan Schutt, and Executive Director, Deven Mitchell, that the Fund’s earnings reserve potentially could run so low on funds that it wouldn’t be able to cover the Legislature’s annual statutory percent of market value (POMV) draw (“Alaska Permanent Fund account that pays for state budget, dividends is under pressure”).
That surprised us because it shouldn’t happen if, as we thought then, the Fund was producing enough earnings annually to meet its “Total Fund Return Objective (CPI +5%).” The “Total Fund Return Objective” for any given year is an overall rate of return on the Fund balance equal to 5% plus the rate of inflation for that year (as measured by the Consumer Price Index (CPI)). For example, if the inflation rate for a given year is 2.5%, the “Total Fund Return Objective” for that year is 7.5% (5% + 2.5%).
Because the POMV draw is also based on 5% of the Fund balance, the Fund’s performance against the Total Fund Return Objective is a good measure of whether it is on track to satisfy both the POMV draw and the annual requirement for inflation proofing (which is calculated using the CPI). Indeed, this measure provides some slack. While the “Total Fund Return Objective” for any given year is calculated on the balance for that year, under the law (AS 37.13.140(b)), the POMV draw is calculated on “the average market value of the fund for the first five of the preceding six fiscal years, including the fiscal year just ended.” Because that “average market value … for the first five of the preceding six fiscal years” is consistently lower than the current Fund balance, meeting or exceeding the “Total Fund Return Objective” in any given year should provide more than enough funds to cover the POMV draw and inflation proofing transfer for the same year.
Moreover, we were surprised because we thought the Legislature had already “prepaid” the transfer for inflation-proofing for several years through two separate ad hoc deposits of $4 billion each in Fiscal Years (FY) 2020 and 2022. This would have provided the remaining earnings reserve with even more cushion because draws on it would not be required to cover transfers for inflation-proofing for those years.
However, the more we dug into the issue, the more we realized something was wrong. First, we learned that while the legislative intent was clear, the PFC hadn’t treated either of the two ad hoc deposits for the intended purpose of pre-paying inflation proofing. Instead, the Legislature continued to transfer from the earnings reserve amounts for inflation proofing that otherwise should have been covered by the prepayments. The effect was to drain the earnings reserve of the cushion the pre-payment was intended to provide.
Second, and much more troubling, we learned that the Fund was not producing enough earnings annually to meet its Total Fund Return Objective. Instead, we realized that in five of the past six years through FY 2024, the Fund had underperformed against the objective. Here are the results over that period:
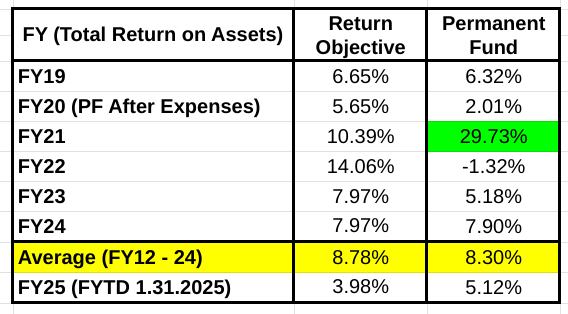
The only year the Fund met or exceeded the Total Fund Return Objective is marked in green. As a result, the annual POMV draw has been depleting the reserve rather than being covered by what is being deposited.
As we dug further into the issue, we also became significantly troubled by the PFC’s proposed solution to the situation. Rather than focus on improving its overall return levels or, in the alternative, suggesting to the Legislature that the 5% POMV rate be reduced to the level that the Fund was earning, the PFC proposed instead to combine the Fund’s two accounts – the principal (or corpus) and the earnings reserve – so that when the Fund failed to earn at the level required to cover the draws on it, the difference would be covered instead through draws on the principal.
As we explained in a previous column, this approach concerns us because, over time, it could lead to significant reductions in, if not the ultimate elimination of, the Fund.
We are also concerned because the PFC’s proposed solution significantly alters its incentives. The incentive to produce returns at least equal to the Total Fund Return Objective is almost entirely eliminated because the draws are covered even when the PFC fails to achieve that goal. Rather than feel pressed to develop investment approaches that produce returns at least equal to the Total Fund Return Objective, the PFC can sit back and accept returns below that level.
It also essentially eliminates the PFC’s incentive to control its costs. Again, because the draws are covered even when the PFC fails to achieve the Total Fund Return Objective, there is no consequence if the PFC’s costs are excessive. Their impact is masked by the fact that the draws can continue uninterrupted.
As we have outlined in our last two columns, there is a better solution to the problem. The following chart reflects what the results would have been had the Fund been invested in one of three alternatives: (1) invested entirely in the S&P 500 ETF, (2) split 90/10 between the S&P 500 ETF and one reflecting the value and returns of the bond market, and (3) split 60/40 between the S&P 500 ETF and one reflecting the value and returns of the bond market.
This chart compares those results to the PFC’s “Total Fund Return Objective” and the PFC’s actual results over the period.
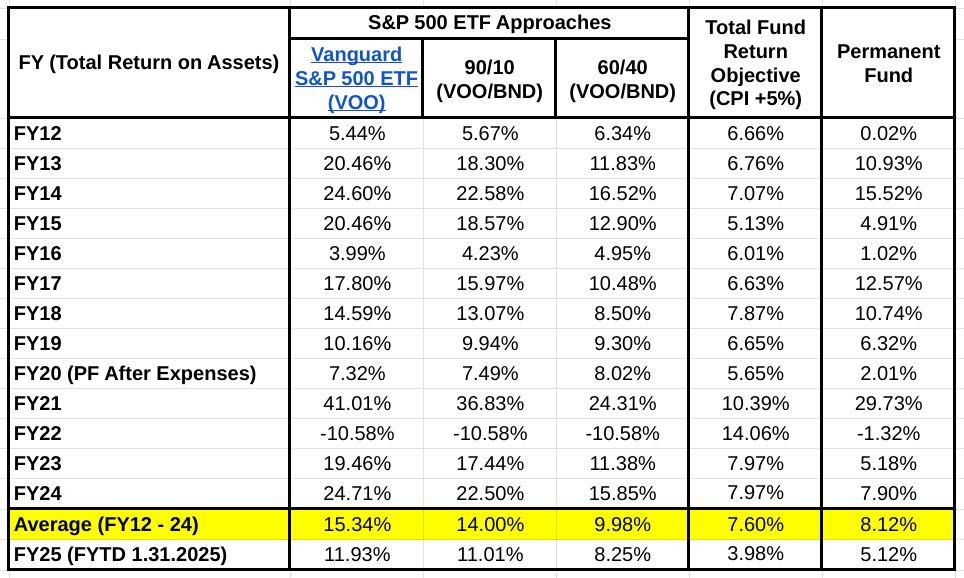
In twelve of the thirteen years over the period, the S&P 500 ETF would have produced higher returns than did the PFC. On average, over the period, the S&P 500 ETF would have produced returns nearly 90% higher than those produced by the PFC. Moreover, the S&P 500 ETF would have met or exceeded the PFC’s “Total Fund Return Objective” in ten of the thirteen years over the period, with an average return over the period that more than double that of the Total Fund Return Objective.
The PFC’s acceptance of lower returns over the period is a failure. The negligence of successive Revenue commissioners to press for the higher POMV draws the higher returns would have produced over the period and into the future is similarly a failure.
As we have explained in previous columns, the key to addressing this situation going forward is to restructure the PFC Board to ensure that it comprises persons with substantial experience in financial investments. Had it been so structured in the past, the chances are significantly higher that the PFC would have identified substantially higher earnings approaches than it has pursued under its current management.
In any event, the current proposal to combine the Fund’s two accounts should be abandoned. As explained above, the proposal would have the opposite effect: It would remove the incentives to maximize the Fund’s returns and keep costs under control.
Should the current Legislature fail to correct the problems, the issue has the potential to become a significant campaign issue during the 2026 state elections. Similar to the 1950s campaign question of “Who Lost China,” in an era of deep, ongoing state budget shortfalls, there likely will be significant political potency behind the question of “Who Is Costing the State Billions of Dollars in Revenue Shortfalls and How Do We Fix That.” We can easily imagine a shorthand campaign slogan of “Fire the PFC Board.”
Brad Keithley is the Managing Director of Alaskans for Sustainable Budgets, a project focused on developing and advocating for economically robust and durable state fiscal policies. You can follow the work of the project on its website, at @AK4SB on Twitter, on its Facebook page or by subscribing to its weekly podcast on Substack.


I am a Coloradan reading this because I absolutely love Alaska and everything about the state, especially the wonderful people. So feel free to tell me to butt out as this is none of my business and my feelings will not be hurt one bit. Besides, I am just a hick and went to a country school, so what do I know anyway. However, this article and the past two on this subject are fascinating. The story being told is Alaskans are taken steadily to the cleaners by the under performance of the PFC Board. How? The PFC Board is… Read more »
This is the up but where is the down? Past performance does not equal future results and we have a State to fund… I am old enough to know stocks also go down.
If funding the State is your concern, then it really should bother you that the PFC has only met or exceeded the Total Fund Return Objective – on which future draws are based – five or the past 13 years and only one of the past six. On the other hand, the S&P 500 ETF approach has met or exceeded the objective 10 of the past 13 years and all but one of the past six. To us, 13 years of data is a pretty good basis for making some judgments. During that time, the S&P 500 ETF produced positive… Read more »
This says it all. Read it and f—ing weep! Every Alaskan should be up in arms! Failure, negligence = malfeasance, criminal really! If we’d invested the PF like Norway using an index fund framework we wouldn’t be in this fiscal crisis – we’d have upwards of $100B MORE! Stop the steal …