As regular followers of our Facebook, LinkedIn, X (formerly Twitter), and Bluesky pages will know, monthly, as information becomes available, we regularly publish a series of charts looking at the Permanent Fund (Fund) through various lenses.
One set of charts, usually published shortly after the beginning of the month, looks at the Permanent Fund Corporation’s (PFC) performance in managing the Fund, both in terms of the returns it is achieving and the costs it is incurring. We are waiting on the PFC’s most recent month-end performance report and significantly delayed FY2025 March Management Fee report to update those.
A second set, usually published in the latter half of the month, looks at Permanent Fund Dividend (PFD) levels under various approaches, including current law (statutory), Percent of Market Value (POMV) 50/50, 33/67, and 25/75, and the current policy, “leftover” approach. We posted our latest look earlier this week.
The third set, also usually published in the latter half of the month, looks at Permanent Fund balances, including a detailed look at the realized (cash) balance of the Fund’s Earnings Reserve Account (ERA), which has been the subject of a substantial amount of discussion over the course of the last two years as the PFC has pushed to change the Fund’s current “two-account” system by constitutional amendment into a single account by merging the ERA with the account holding the Fund’s principal.
This week’s column focuses on the third set, where we are making some changes this month in how we regularly look at the balances of both the overall Fund, as well as specifically, how we look at the ERA. We will publish a full suite of this third set early next week.
Previously, the third set has contained four charts. The first has focused on the overall balances of the Permanent Fund and the Alaska retirement funds, the state’s other large-scale investment fund, which the Department of Revenue manages. The second has focused on the ERA, as accounted for by the PFC. The third has restated the current balance of the ERA to reflect some needed adjustments, which we discussed in a previous column on these pages. The fourth has built on the third to project ERA levels through the remainder of the current projection period (FY 2025 – 36).
Going forward, we are modifying this third set to add one chart to our examination of the overall Permanent Fund balance and replace one of the ERA charts to better restate the projected balance of the ERA through the remainder of the current projection period.
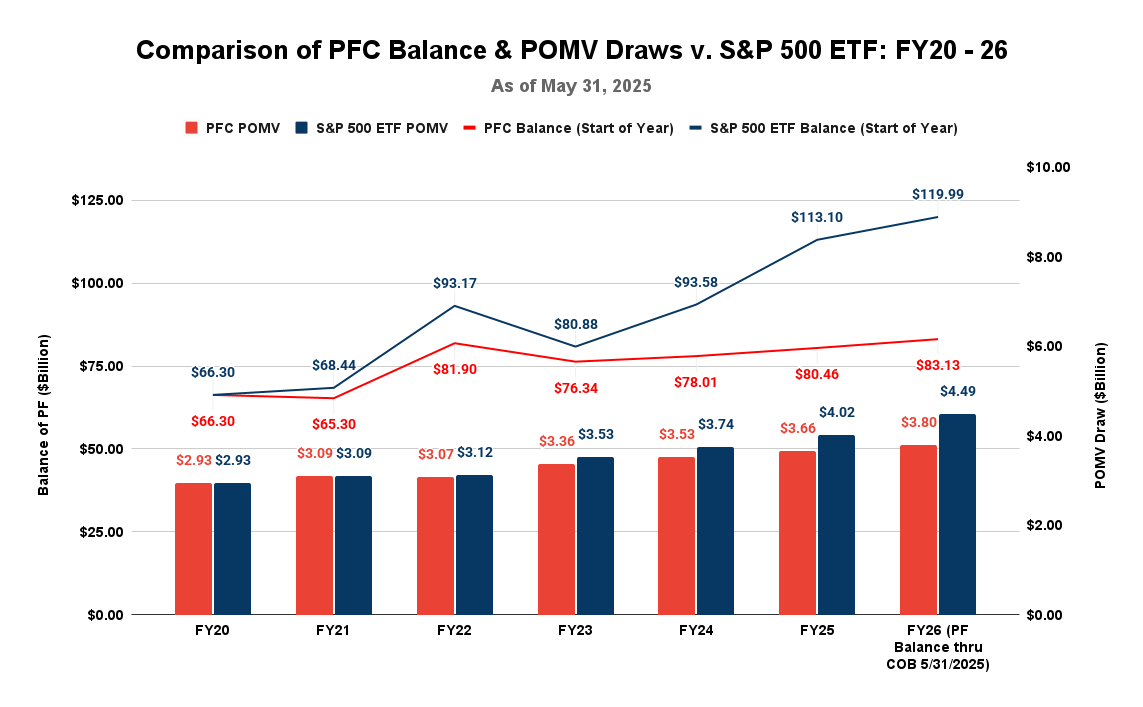
Consistent with our discussion in previous columns, the chart we are adding is to compare on an ongoing basis the balance of the Permanent Fund using the PFC’s current investment approach to the balance of the Fund had it pursued the S&P 500 Exchange-Traded Fund (ETF) approach beginning with FY2020.
We calculate the balance of the Permanent Fund using its regular end-of-month Financial Statements, including the “transfers in” from appropriations of royalty and “transfers out” to fund the POMV draws.
We calculate the balance of the Fund as if it had pursued the S&P 500 ETF approach, by starting at the same place at the beginning of FY2020, adding the “transfers in” from royalty at the same level as reflected in the PFC’s Financial Statements and calculating the “transfers out” to fund the POMV draws if they had been based on the fund balances resulting from the approach. We calculate the amount that the Fund would have grown through investments by using the returns achieved over the same period on Vanguard’s S&P 500 ETF, taken from industry source TotaRealReturns.com.
Some have suggested that the latter approach overlooks the operating expenses incurred by the PFC in its management of the Fund. But that’s part of the point of the alternative. As we explained in a previous column, as a passive investment based on an ETF, there are minimal expenses, a fraction of what is being incurred by the PFC under its approach. And what expenses there may be are incorporated mainly in the reported returns.
Here’s the resulting chart for FY 2025 through the end of May, the most recent for which the PFC has published Financial Statements.

The balances are current through the end of May. As reported by the PFC, the balance of the Fund as of the end of May was $83.13 billion. Based on its average balances over the previous five of the last six years – the statutory standard – the PFC calculates the FY26 POMV draw at $3.80 billion.
As calculated using the approach we describe above, as of the end of May, the balance of the S&P 500 ETF alternative would have been $119.99 billion, 44% higher than the PFC’s. Based on the average balances over the same period as used by the PFC, the FY26 POMV draw would be $4.49 billion, 18% higher than the PFC’s and growing.
We will continue publishing regular updates of this chart as part of our monthly set of charts that look at Fund balances.
The second change we are making to the third set of charts is to replace one of the charts that looks at the balance of the ERA.
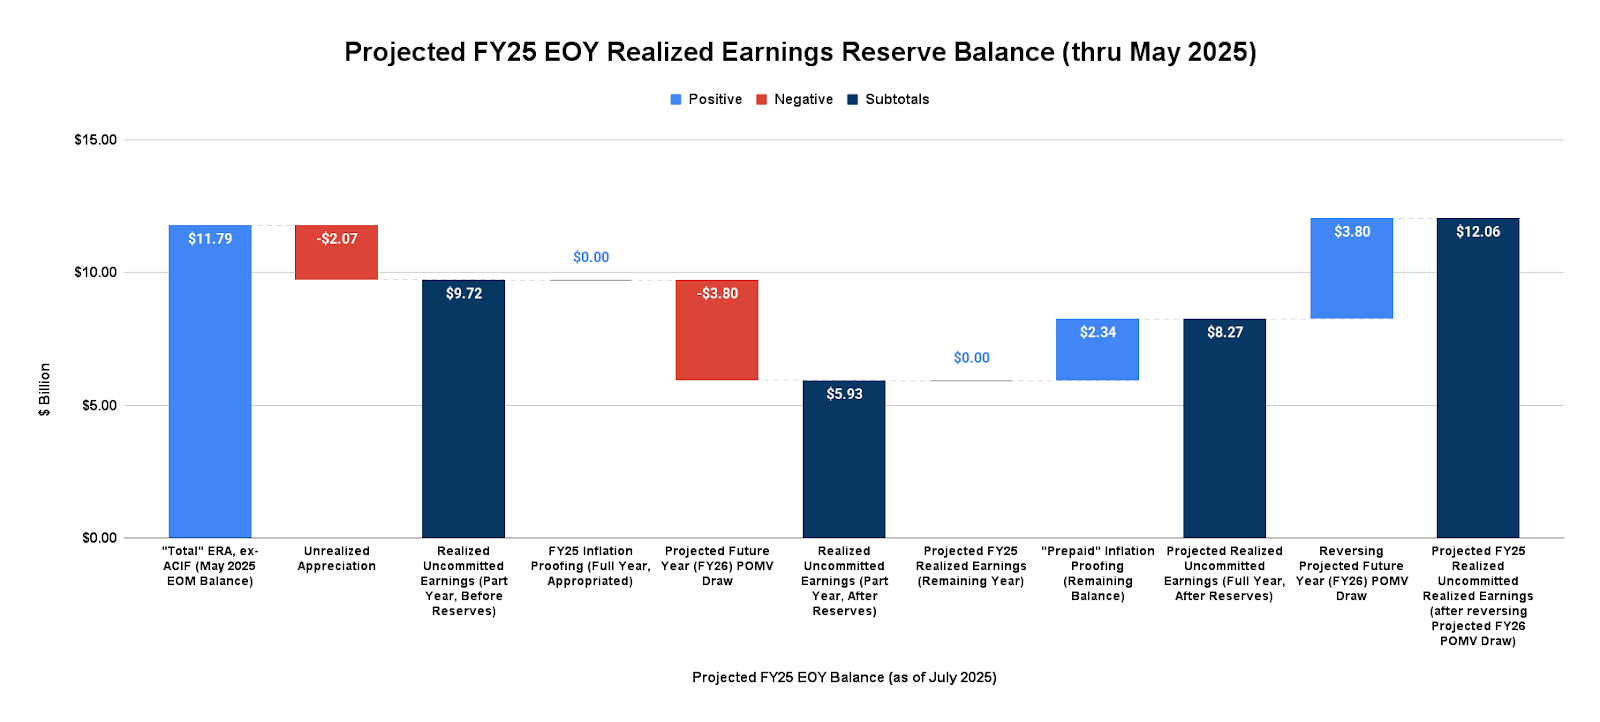
As we explained in a previous column, over the last few years, the balance of the ERA has been materially understated due to its failure to recognize certain prepayments that the Legislature made for inflation-proofing in FY20 and FY22, as well as some accounting approaches the PFC has used to account for projected expenses.
In this year’s appropriations bill, the Legislature has corrected for those problems somewhat by, in Section 52 of the bill, reversing the additional contribution for inflation-proofing it had previously appropriated for FY25 and, in Section 25(f), directing the PFC to use the ad hoc contribution the Legislature made in the FY22 budget as forward funding of the payment for FY26 inflation-proofing. While a prepayment balance remains ($2.34 billion as of the end of FY25 and $840 million as of the end of FY26), both of the Legislature’s actions reduce the level of prepayments the PFC had previously failed to recognize in its reports, bringing its reports more in line with the actual account balances.
We will continue to reflect the remaining adjustments in the third chart of the set. Based on the PFC’s May 2025 Financial Statement, that chart is as follows:

The chart we are replacing is the fourth in the set, in which, building on the third, we project ERA balances through the remainder of the current projection period.
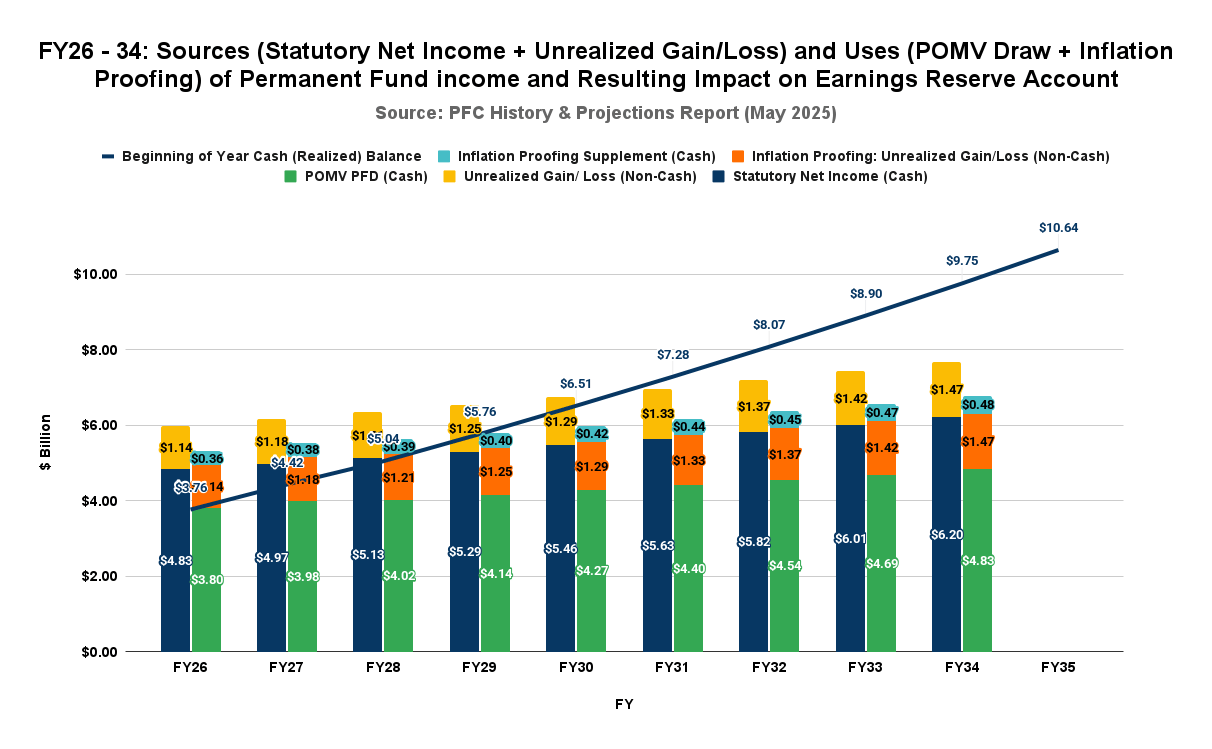
Consistent with a recent column on the subject, we are replacing our previous approach with a chart that better reflects the use in future years of non-cash income (unrealized appreciation) to meet inflation-proofing requirements. Under Generally Accepted Accounting Principles (GAAP), unrealized appreciation is as much “income from the permanent fund” within the meaning of Art. 9, Sec. 15 of the Alaska Constitution as cash earnings. As we suggest in the column, it can – and should – be applied to meeting the requirements of inflation-proofing, a non-cash use of the Fund.
Here is a current chart incorporating that approach:

The “income from the permanent fund,” composed of both cash (realized) and non-cash (unrealized) earnings, for each year, is reflected on the left bar. The use of the income, composed of covering the POMV draw and reinvesting a portion of the income to cover inflation proofing, is reflected on the right bar. The difference between the two represents the amount by which projected annual income exceeds its uses. That amount then adds to the previous amount of income retained annually in the earnings reserved account.
As is clear from the results, by using non-cash income to help cover inflation-proofing, the earnings reserve account grows over time, instead of declining as some have projected. As with the previous change, we will continue publishing regular updates of this chart as part of our monthly set of charts that look at Fund balances.
The purpose of these monthly charts is to help keep track of the Permanent Fund balances, the resulting POMV levels, and the status of the ERA. We hope that readers find them useful in their evaluation of each.
Brad Keithley is the Managing Director of Alaskans for Sustainable Budgets, a project focused on developing and advocating for economically robust and durable state fiscal policies. You can follow the work of the project on its website, at @AK4SB on Twitter, on its Facebook page or by subscribing to its weekly podcast on Substack.


I continue to disagree with you regarding your wouldda-couldda-shouldda approach to the Permanent fund. I am an Alaskan senior and 55-year Fairbanks resident on fixed income, low enough to qualify for Senior Benefits from our Public Assistance program. My life savings, unimpressive as they are, are invested in Vanguard mutual funds. They are NOT 100% in the S&P 500, which has a higher risk rating than I, at my age, can tolerate. I need my savings to last thru my lifetime, however much of it remains. The PF should be exactly that, PERMANENT! It needs to last long after my… Read more »
The Permanent Fund isn’t a retirement account that should reduce risk nearer a specific date to ensure a given payout over a remaining life. Alaska isn’t analogous to a single-generational person. Instead, Alaska is an ongoing multi-generational enterprise. As a result, the Permanent Fund should be viewed as a wealth-building account geared toward the long-term, that spins off some income now and builds multi-generational wealth that takes advantage of the strengths of fundamental long-term American growth. Like any long-term investor, it should be viewed as a way to invest for some near-term income but also significant long-term appreciation. As the… Read more »
Hope for the best, but plan for the worst – that’s what PERMANENT means to me.
Hope for the best but plan for the worst.
https://mustreadalaska.com/alaska-permanent-fund-sets-another-new-all-time-high-second-time-this-month/
“………..According to the Alaska Permanent Fund Corporation, the fund closed at $84,249,900,000 on June 27. That’s nearly $1 billion higher than its previous high of $83.3 billion recorded earlier this month, and more than $2 billion above the former record of $82.1 billion set back in December 2021……….”
Ya, and Norway, which started it’s soveriegn weath fund some many years later than alaska, has a current market value somewhat north of 1.4 TRILLION dollars equivilant. And a citizen retirement fund which also exceeds 1 TRILLION. Interesting, if one just puts their mind to it.
Norway doesn’t have a PFD. The earnings are reinvested, not wasted on consumer junk.