Last year at this time, we published a June 2022 revenue update. As we explained then:
The Department of Revenue publishes two formal revenue updates each fiscal year. The first is the detailed Fall Revenue Sources Book, published in December in connection with the submission of the governor’s budget. The second is the Spring Revenue Forecast, published three months later, in March, as the Legislature comes to grips with the annual budget.
While the Department also publishes occasional updates, those have a more limited circulation and aren’t as widely used as a public source of data for changes in the state’s fiscal outlook.
So, as part of our Alaska Landmine “Chart of the Week” series, we are going to attempt to help fill in the 9-month gap between the Fall and Spring forecasts with two additional three-month looks in mid-June and mid-September.
That update focused on changes in oil prices, production volumes, percent of market value (POMV) draw, and Permanent Fund Dividend (PFD) levels, and from those, Unrestricted General Fund (UGF) levels since the time of the preceding Spring Revenue Forecast.
This year’s June update will do the same with respect to the Department of Revenue (DOR)’s most recent Spring 2023 Revenue Forecast (published March 21, 2023).
Oil prices
As those following state finances know, the state’s forward-looking oil price projections have been on a roller coaster for the last two years. We chart the evolution here:
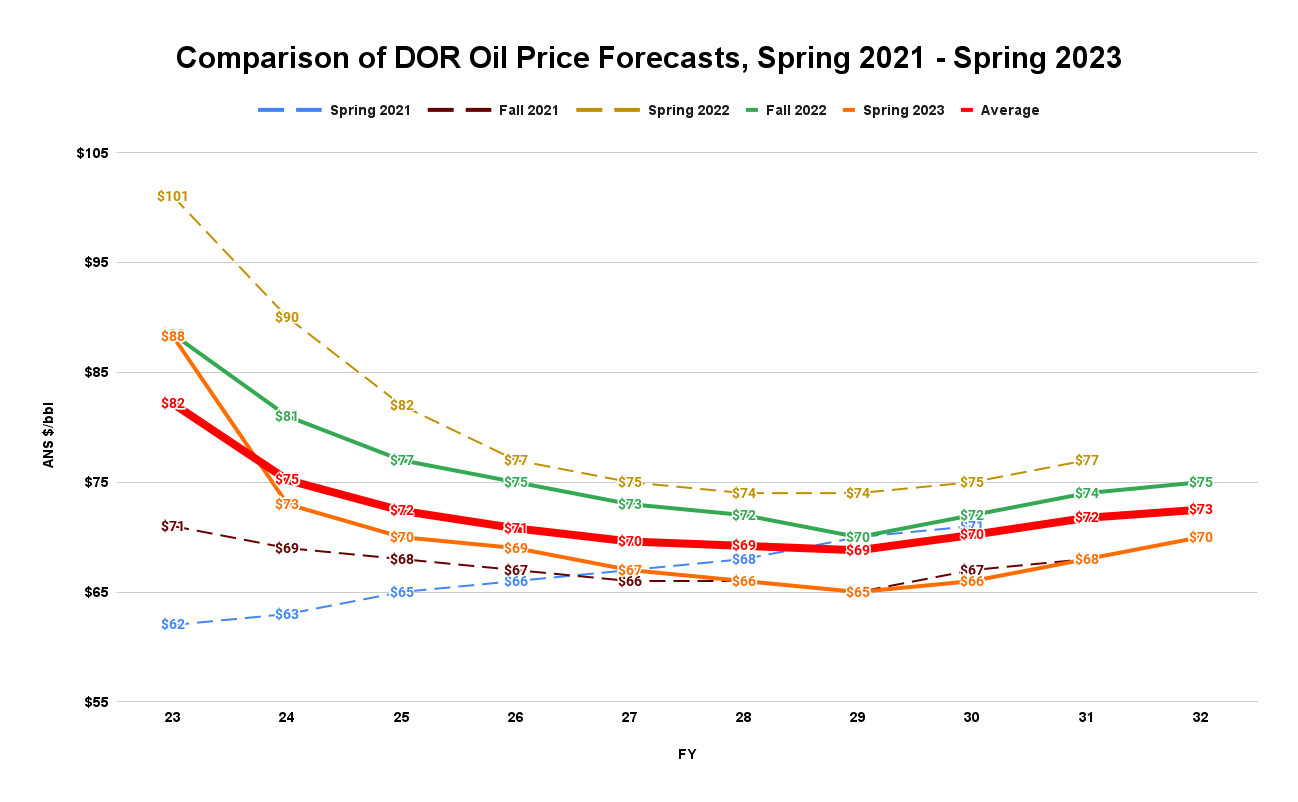
From recent, near-term lows in the Spring 2021 Forecast (dashed, in blue), the projected levels rose in the Fall 2021 Forecast (dashed, in maroon), then soared significantly to near-term highs in the Spring 2022 Forecast (dashed, in gold), before coming back down in the Fall 2022 Forecast (solid, in green).
Projected prices in DOR’s most recent Spring 2023 Forecast (solid, in orange) are down again from Fall 2022 forecast levels to a long-term level slightly below the average of all of the projections made over the period (solid, in red).
Surprisingly given this recent volatility pattern, projected FY23-32 price levels haven’t changed much in the three months since the Spring 2023 Forecast. Before the projections for FY30, when they start diverting, current futures price levels (solid, in green) taken from our most recent Friday chart are running only slightly ahead of those contained in the Spring 2023 Forecast (solid, in orange).
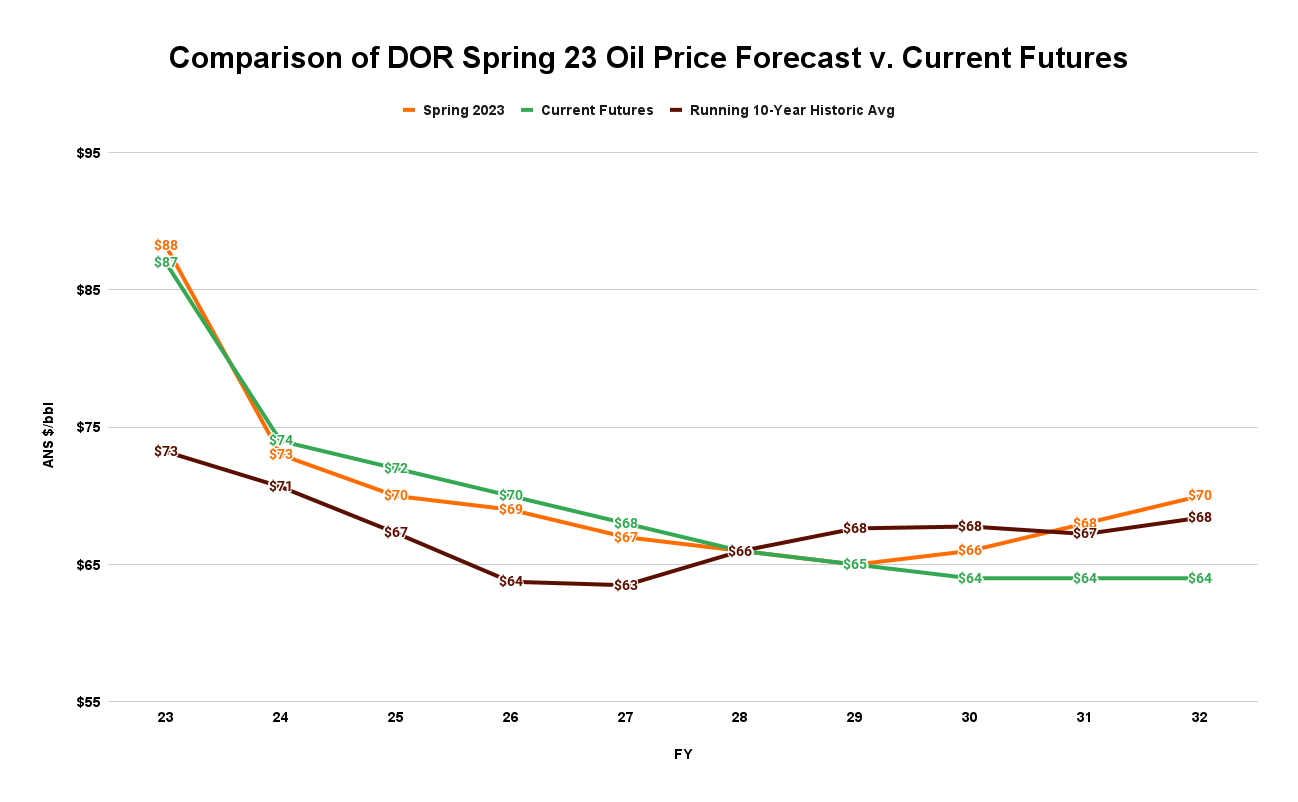
They divert after that point primarily because of differences in methodology. Reported futures prices for Brent – the foundation for both approaches – only go out on the Intercontinental Exchange (ICE) to the end of the calendar year 2029 – or the midpoint of FY30.
After that, DOR calculates its projected FY31 and FY32 prices by adjusting the last reported price for projected inflation. On the other hand, to capture the most recent direction in pricing, we use the reported price for Brent for FY31 from the New York Mercantile Exchange (CME Group) and calculate FY32 by extending the trendline from the last two reported years. Even then, the differences are not significant, given their distance into the future.
As some readers will recall, in previous columns, we have urged that oil revenues for budgeting purposes should be established based on a rolling, 10-year historical average, potentially with sideboards. Using the rolling, 10-year historical average (solid, in dark red) would result in somewhat lower price levels for budgeting purposes over the next four years but slightly higher price levels beyond that. By moderating the wild swings in projected annual revenues that the current approach produces, we believe the 10-year, historical averaging approach should be used for budgeting purposes by future administrations and legislatures.
Oil volumes
Unlike oil price projections, those for near-term production levels have mostly stayed the same over the past two years.

Projections of Alaska North Slope (ANS) production volumes for FY23, for example, have only varied between 476.6 thousand barrels per day (MBD) (in the Spring 2021 Forecast) and 502.3 MBD (Spring 2022 Forecast), a difference of only five percent. Based on reported production volumes, the likely final FY23 production level of around 480.2 MBD is well within that range.
Past projections for FY24 have been even tighter, varying only between a low of 496.4 MBD (Spring 2023 Forecast) and 503.2 MBD (Spring 2022 Forecast), a difference of less than two percent. That would appear to indicate that the most recent Spring 2023 Forecast of FY24 production levels is well-based.
We would add one word of caution, however. As noted on the following chart, actual production levels have come in lower than the immediately preceding Spring forecast in four of the past five years.

Except for the current year (FY23), each drop has been foreshadowed by a decline in projected production levels from the immediately preceding Fall to the Spring Forecast. There has been a similar drop in projected FY24 levels from the immediately preceding Fall 2022 to the Spring 2023 Forecast.
As a result, it should not be unexpected for actual FY24 production levels to end up lower than the most recent Spring 2023 Forecast suggests. As a frame of reference, the average underage over the previous five years is 3.5% or about 18 MBD.
Traditional Revenues
Traditional (or “trad”) revenues are the combination of oil and other unrestricted general fund revenues (other than those derived from the POMV draw). Estimates of traditional revenues at various oil price levels can be calculated using the price sensitivity analysis prepared by the Department of Revenue (DOR) in connection with each Fall and Spring Forecast.
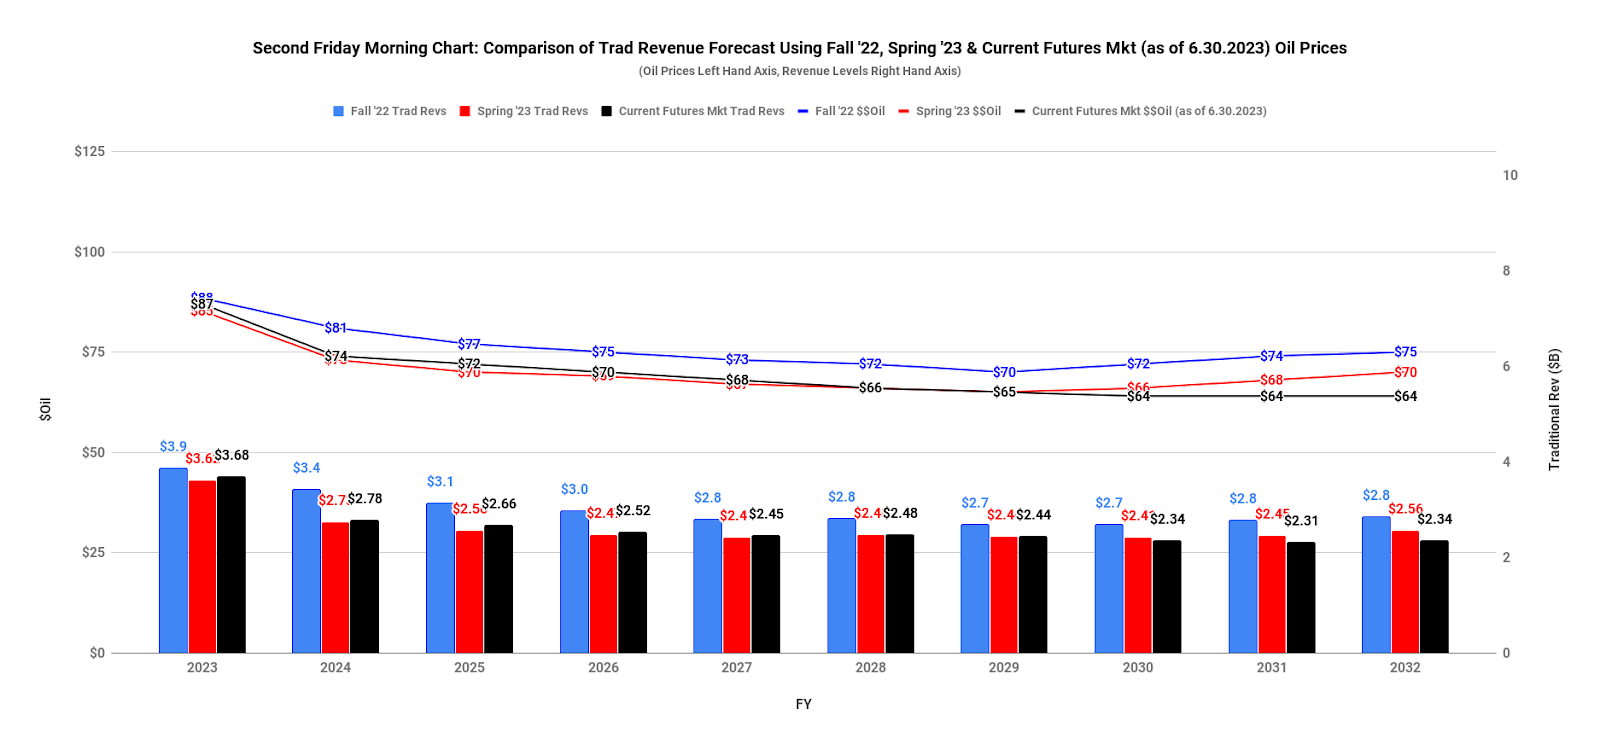
As followers of our Facebook and Twitter feeds will know, each Friday, in connection with publishing our analysis of the current prices prevailing in the futures markets, we also post an updated projection of future “trad” revenue levels, calculated based on the current futures prices using the most recent DOR price sensitivity analysis.
Our most recent projections, published earlier today, are these:
For those interested in the detail, the numbers are here:
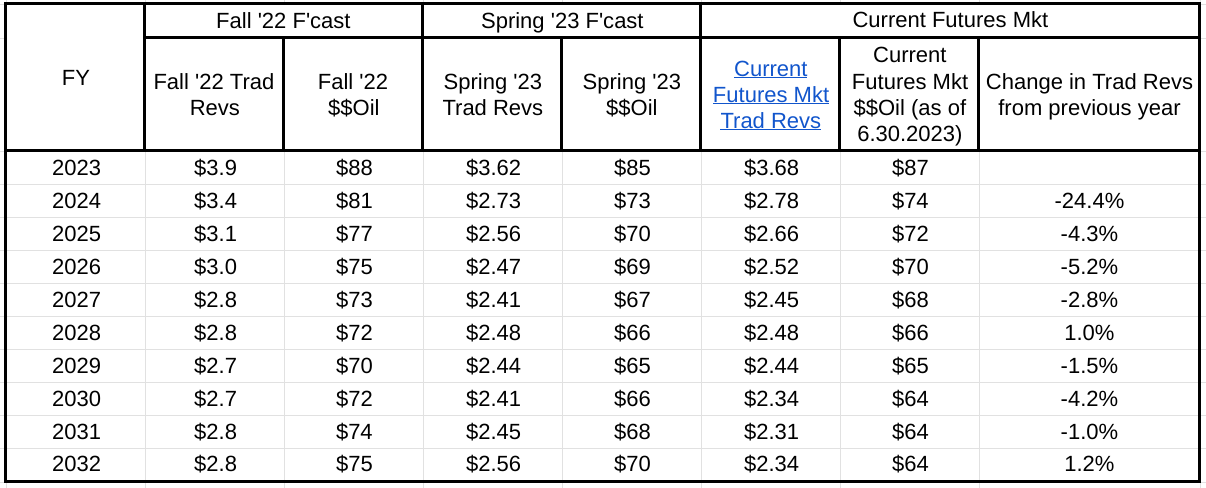
As with oil prices, projected traditional revenues based on the current futures market remain very close to those reflected in the Spring 2023 Forecast up until FY30, and even then, divert only slightly.
Based on the decline in projected oil prices, projected traditional revenues drop significantly – by nearly 25% – between FY23 and FY24 and then continue to float down after that at an average rate over the period of roughly 2% per year.
We would add that projected traditional revenues drop more as a percent over the period than oil prices because of Alaska’s progressive oil tax system. Under its current oil tax approach, Alaska takes more in revenues at higher oil prices and, concomitantly, less at lower oil prices. During periods of falling oil prices, the revenues taken from each barrel fall at a faster rate than the prices.
As we will discuss further at the end of this column, assuming spending continues to rise as projected, the continued decline in traditional revenues also means the fiscal gap will continue to widen over the period.
Permanent Fund POMV Draw and PFD Levels
While the Spring 2023 Revenue Forecast contains projections of the annual percent of market value (POMV) draws from Permanent Fund earnings, it does not contain projections of Permanent Fund Dividend (PFD) levels, and thus, the portion of the POMV draw available for government spending under current law.
Projected PFD levels can be calculated, however, from the monthly “History and Projections” reports published by the Permanent Fund Corporation.
Using those, here is a comparison of the POMV draw, PFD levels, and the resulting portion of the POMV draw available for government spending under current law at the time of the Spring 2023 Revenue Forecast and currently:

While projected POMV levels have declined since the time of the Spring 2023 Revenue Forecast due to lowered return expectations, so have projected PFD levels, with the net result that the portion of the POMV remaining for government under current law has remained relatively stable. While the average projected POMV level between the two periods has declined by 4.5% and the average PFD level by 6.2%, the portion of the POMV remaining for government under current law actually increases over the first five years between the two sets of projections, and, overall, declines by less than 1% on average.
Total UGF Revenues (ex-PFD)
Total UGF revenues are traditional revenues plus the portion of the POMV draw remaining for government after deducting the amount to be distributed as PFDs. For the purposes of these updates, we have prepared the projections of the portion of the POMV draw remaining for government under two different PFD approaches.
The first approach uses the PFD as calculated under current law (the “statutory PFD” approach). The amount available for government is taken from the chart in the previous section.
The second approach uses the PFD as calculated under the POMV 50/50 approach, sometimes proposed by Governor Mike Dunleavy (R – Alaska) and included as a recommendation in the Legislature’s 2021 Fiscal Policy Working Group Final Report. The amount available for government is 50% of the total POMV draw.
Here are the current projections for each, compared to the projection for the “current law” outcome as of the time of the Spring 2023 Forecast:

As we noted previously, because of the steeper decline in projected statutory PFD levels than those projected for the POMV draw, total UGF revenues available for government under current law actually are projected in this June 2023 estimate to be up slightly for the next five years over those derived from the Spring 2023 Forecast.
Due to the offset between a slight increase in projected traditional revenues and a slight decrease in the POMV draw, total UGF revenues available for government under the POMV 50/50 approach are about the same as at the time of the Spring 2023 Forecast.
As some will quickly point out, a budget gap remains under either approach. While we will dive deeper into the issue in a subsequent column, here is the remaining difference under both approaches compared to the “current law” spending levels projected by the Legislative Finance Division in its “Overview of the Governor’s [FY24 Budget] Request,” the baseline that most closely fits the FY24 budget developed in the recent legislative session:
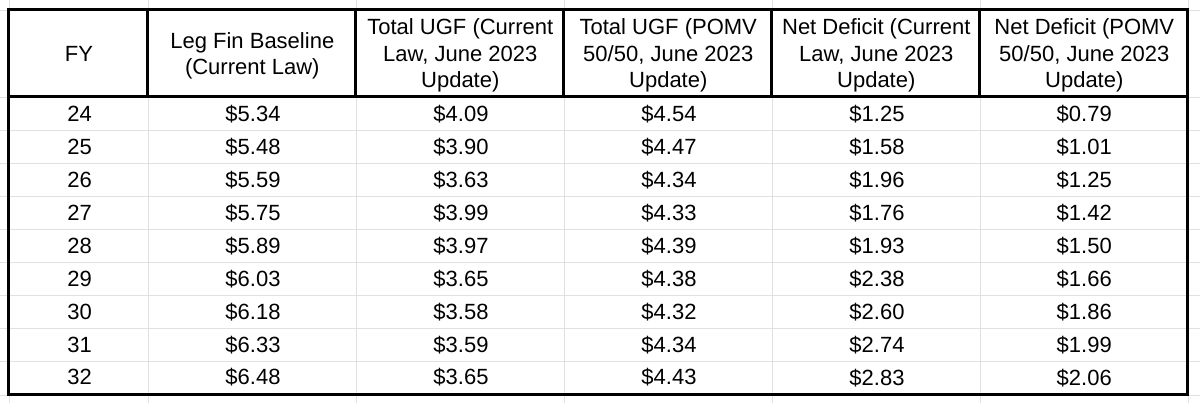
As noted, the gap widens over time under both approaches as traditional revenues decline while spending increases. Some use that as a reason for continuing to press for “POMV 25/75” or other PFD-based alternatives.
But as we have made repeatedly clear in previous columns and will continue to do in the future, it is objectively better overall for both Alaska families and the Alaska economy to meet these additional revenue requirements through other revenue approaches – flat, income or sales taxes, for example – rather than through even deeper cuts to the PFD.
As we did last year, we will provide our next 3-month overall update in a mid-September posting on these pages. In the meantime, we encourage those interested in remaining current with the outlook for Alaska revenue to follow our weekly updates of the various components on our Facebook and Twitter feeds.
Brad Keithley is the Managing Director of Alaskans for Sustainable Budgets, a project focused on developing and advocating for economically robust and durable state fiscal policies. You can follow the work of the project on its website, at @AK4SB on Twitter, on its Facebook page or by subscribing to its weekly podcast on Substack.


