Last week we looked at the impact of Senate Bill 107 (SB 107) on the Alaska economy and jobs.
SB 107 is the Senate Finance Committee’s proposal to permanently reduce the Permanent Fund Dividend (PFD) from the current statutory approach to an amount equal to 25% of the annual percent of market value (POMV) draw from the Permanent Fund.
As explained by the Committee, the purpose of the bill is to raise the amount of unrestricted general fund (UGF) revenues available to government. It would do so by reducing the amount of Permanent Fund earnings distributed to Alaskans through the PFD, a step that former Governor Jay Hammond referred to as a “‘head tax’ on all and only Alaskans” and what Alaska Beacon writer James Brooks recently described as a “regressive tax,” and diverting those funds instead to UGF revenues available to government.
As we explained last week, the amount of the reduction, or tax, would be substantial.
Between FY 24 and FY32, the effect would be a reduction in the current law PFD (a “PFD cut”) – and a corresponding increase in the amount of UGF revenues available to government – of between $1.41 and $1.95 billion annually over the period.
The total amount diverted over the period is $15.25 billion; the average annual reduction is $1.7 billion.
And compared to the alternatives, the impact of SB 107 on the Alaska economy and jobs would be significantly negative. Over the period, the approach would reduce full-time equivalent (FTE) jobs in Alaska by 8% more than would occur if the same amount were raised for government using an income tax, 9% more than would occur using “flat tax” and either 12 or 14% more than a sales tax, depending on the type of sales tax.
The approach also would also reduce Alaska income by 6% more than would occur if the same amount were raised for government using an income tax, 7% more than would occur using ISER’s proxy “flat tax,” and either 10 or 11% more than using a sales tax, depending on the type of sales tax.
This week we look at the impact of SB 107 on Alaska families. It’s not any better than the impact on the economy; in fact, it’s worse.
As researchers at the University of Alaska – Anchorage’s Institute of Social and Economic Research (ISER) concluded in a 2017 study of the various revenue alternatives – PFD cuts, sales tax, income tax or property tax – “[a] cut in PFDs would be by far the costliest measure for Alaska families.” SB 107 demonstrates that, in spades.
To examine, we look at the impact on Alaska families of SB 107 compared to the most “flat” of the “flat tax” alternatives (“Option 1”) analyzed in a 2021 study for the Legislature by the Institute on Taxation and Economic Policy (ITEP).
Generally speaking, the benefit of a “flat tax” is that it distributes the fiscal burden proportionately to all income brackets. No one bracket pays more so that another pays less, i.e., there are no inter-bracket subsidies.
In that sense, a flat tax is distributionally neutral. While the 2021 study’s Option 1 is not perfectly neutral – mostly because it excludes PFD income from the tax, which lowers the impact at the bottom end of the income range – it nevertheless is close and is the most distributionally neutral of the alternatives evaluated in the ITEP study.
Unlike PFD cuts, which raise revenue only from Alaskans, a flat tax also would raise a material portion of the revenue requirement from non-residents receiving income in the state. Based on the 2016 ISER study we discussed in last week’s column, a flat tax would reduce the amount required to be raised from – or put differently, the burden on – Alaskans by around 7%, compared to PFD cuts. Alaskans as a whole would pay less because a portion of the revenue requirement would be covered by non-residents.
Using the Option 1 flat tax as a baseline enables us to assess how families are being affected by SB 107 – which families are bearing more and which less than the overall average burden – and the effect of shifting the burden entirely to Alaska families, letting non-residents, as former Governor Hammond put it, off “scot-free.”
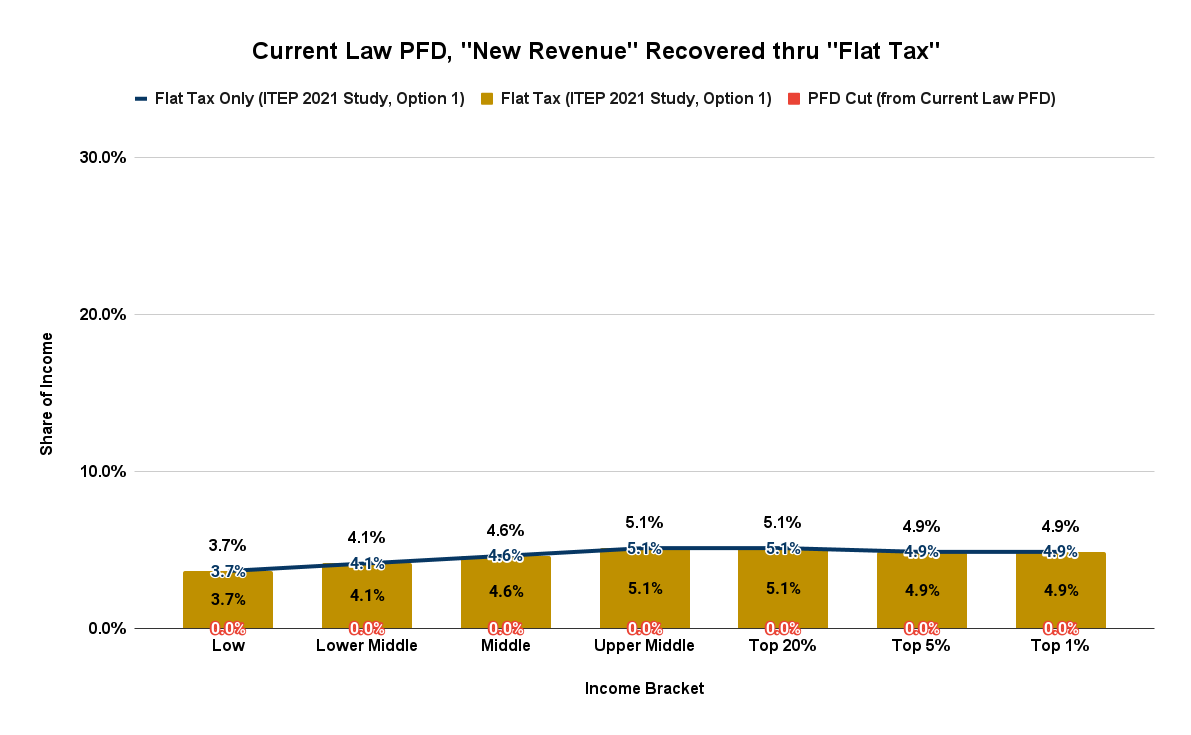
As a baseline, here’s the impact on Alaska families by income bracket if, instead of PFD cuts, the Option 1 flat tax was used to recover the full $1.7 billion in annual UGF revenue proposed to be raised for government by SB 107.

At a revenue requirement of $1.7 billion, about 5% of overall Alaska annual income would be shifted from the private sector to government under all of the alternatives, including SB 107.
Under a flat tax, all income brackets contribute relatively equally at the overall average. Due to the exclusion of PFD income and a few other things, under ITEP’s 2021 Option 1 approach, those in some income brackets would contribute slightly more or less than the overall average. But the variations are small. All Alaskans would contribute within 25% of the 5% overall average.
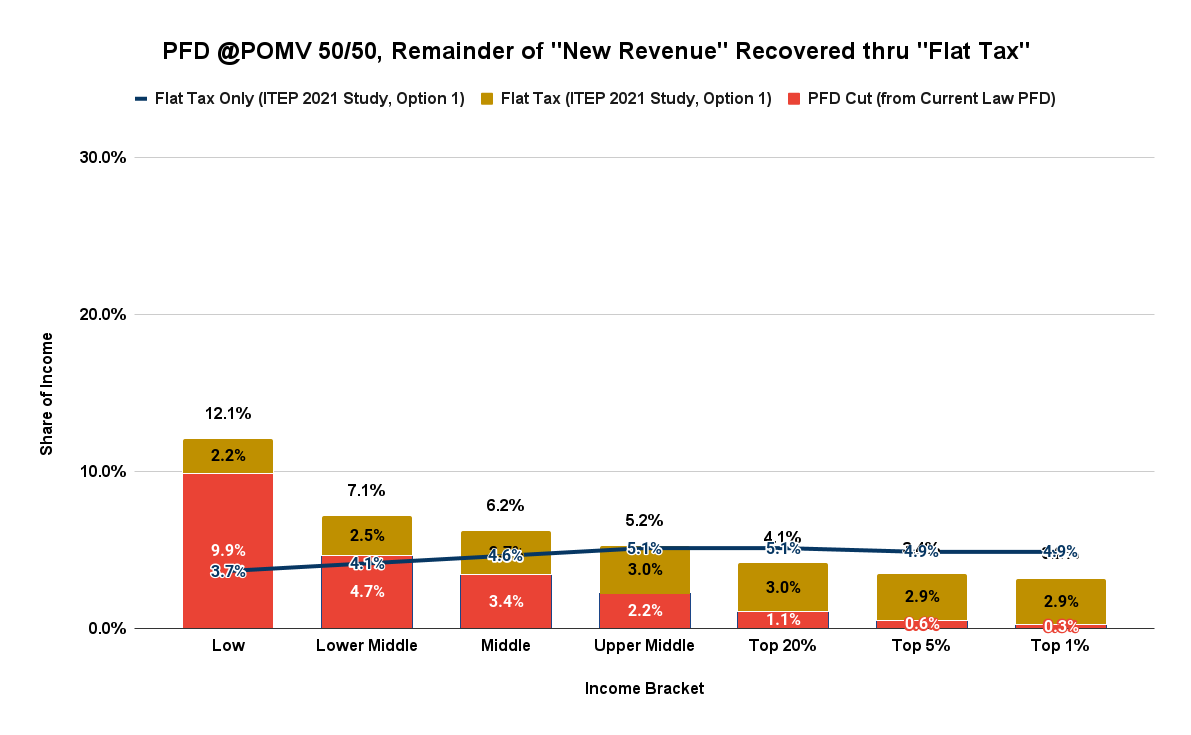
On the other hand, here’s the impact on Alaska families by income bracket if a POMV 50/50 approach was used to raise some of the revenue requirement and the Option 1 flat tax was used to recover the remainder. On average, over the period, a POMV 50/50 approach would raise about $700 million – or roughly 40% – of the targeted $1.7 billion. The Option 1 approach would raise the remaining $1 billion.

While the overall average remains at roughly 5%, injecting PFD cuts into the mix (even just to POMV 50/50) significantly tilts the distribution. Compared to retaining the current law PFD and using the Option 1 flat tax approach to raise the entire $1.7 billion (the solid line in the chart above), 80% of Alaska families – those in the upper middle, middle, lower middle, and low-income brackets – would be required to contribute materially more (combined total above the line), while those in the top 20% would contribute materially less (combined total below the line).
Rather than all Alaska families contributing within 25% of the average, low-income Alaska families would contribute nearly 2.5 times more, lower middle-income families 1.4 times more, and even middle-income Alaska families 1.25 times more than the overall average.
Conversely, the top 20% overall would contribute 20% less, the top 5% nearly 30% less, and the top 1% nearly 40% less than the average.
Put another way, low-income Alaska families would contribute 3.78 times (378%) more, lower middle-income Alaska families 2.21 times more, middle-income Alaska families 1.93 times more, upper middle-income Alaska families 1.62 times more, and even those generally in the top 20% 1.28 times more than those in the top 1%.
Those are significantly regressive levels.
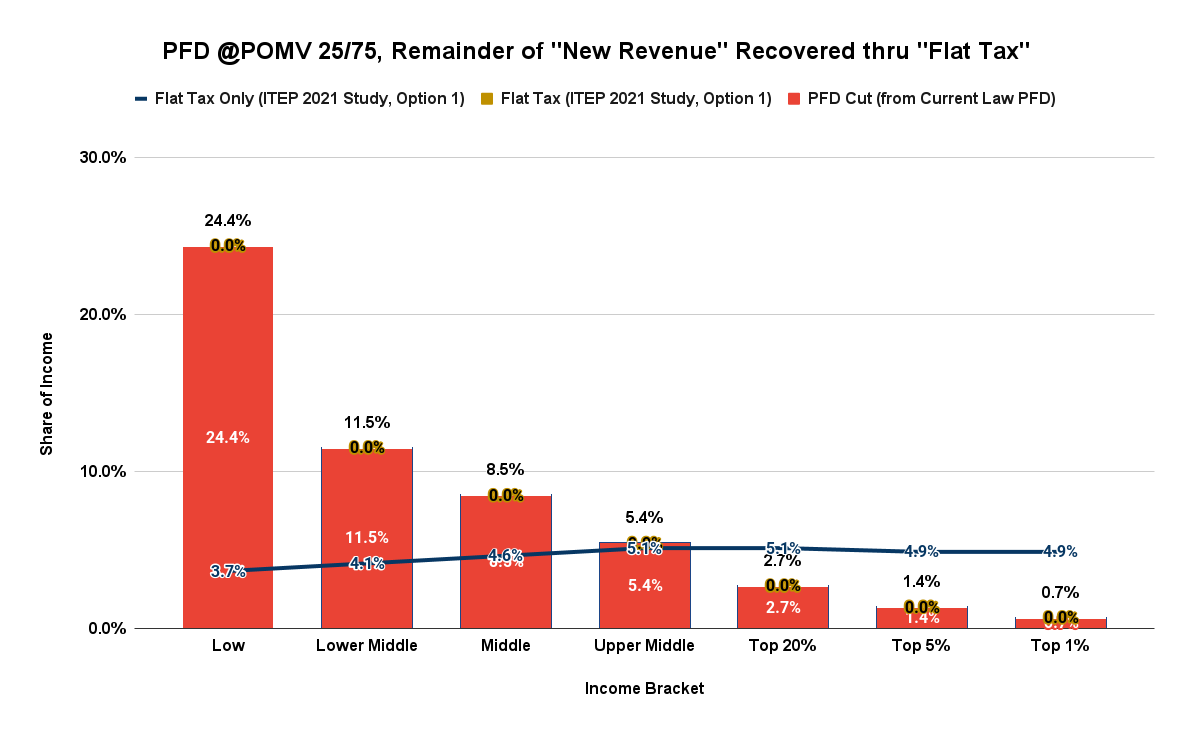
But even those disproportionate impacts pale by comparison to those which would result under SB 107, which proposes to recover the entire $1.7 billion solely through PFD cuts. Here’s the impact on Alaska families of that approach by income bracket:

Like the POMV 50/50 option, 80% of Alaska families – those in the upper middle, middle, lower middle, and low-income brackets – would contribute more, while those in the top 20% would contribute less than using a flat tax approach.
But while the overall average impact again remains at 5%, SB 107 would tilt the distribution even more significantly than using POMV 50/50.
Rather than low-income Alaska families contributing 2.5 times more than the average as under the POMV 50/50 approach, under SB 107, low-income Alaska families would contribute nearly five times more than the average, with lower middle-income Alaska families contributing 2.3 times more and middle-income Alaska families contributing 1.7 times more than the average.
Conversely, the top 20% would contribute nearly 50% less, the top 5% more than 70% less, and the top 1% more than 85% less than the average.
And the comparisons of the impact on the other brackets to the top 1% – another way of measuring regressivity – are off the charts.
Under SB 107, low-income Alaska families would contribute nearly 35 times (3485%) more, lower middle-income Alaska families 16.6 times more, middle-income Alaska families 12.1 times more, upper middle-income Alaska families 7.7 times more, and even those generally in the top 20% 3.9 times more than those in the top 1%.
Using ITEP’s most recent “Who Pays?” study of state and local fiscal structures as a reference, there is no more regressive fiscal approach in the nation. Indeed, none are even remotely close in terms of regressivity to that proposed by SB 107.
Another useful means of demonstrating the regressivity of SB 107 is to compare its impact to that which likely would result from House Bill 142 (HB 142), Representative Ben Carpenter’s (R – Nikiski) proposed sales and use tax.
Some recently have attacked HB 142 as a “‘stealth tax,’ which will disproportionately impact lower-income Alaskans and women,” and there is no question that HB 142 is regressive and would have exactly that effect – “disproportionately impact lower-income Alaskans and women.”
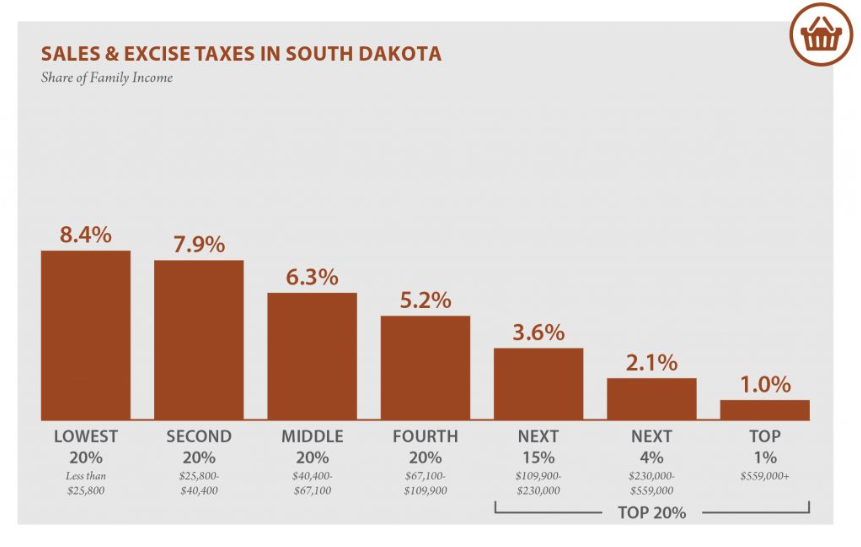
While, to our knowledge, no distributional analysis of HB 142 has yet been released, we can get some idea of what it likely will look like by looking at the distributional impact of South Dakota’s sales and excise tax approach, on which HB 142 is based.
Although the absolute results would be different – South Dakota’s sales tax is roughly 4% and HB 142 proposes a 2% rate, and the size of the tax bases are different as well – the distribution of the burden between income brackets should be similar.
Here is the distributional impact of South Dakota’s approach, as taken from the latest version of ITEP’s “Who Pays” study:

Assuming the distributional results of HB 142 are similar, low-income Alaska families would contribute roughly 8.5 times more, lower middle-income Alaska families eight times more, middle-income Alaska families 6.3 times more, upper middle-income Alaska families 5.2 times more, and even those generally in the top 20% 3.2 times more than those in the top 1%.
Indeed, that’s significantly regressive. But as regressive as it is, the level pales in comparison to the “disproportionate impact on lower-income Alaskans and women” of SB 107 calculated above.
If some are concerned about the adverse impact of HB 142 on Alaska families, they should be concerned multiple times more with SB 107. Put another way, as objectionable as HB 142 may be on the basis of regressivity, it is miles better than SB 107. If enacting SB 107 is the only other alternative, HB 142 provides the much better choice for Alaska families, particularly including “lower-income Alaskans and women.”
Of course, as we demonstrate above, a flat tax is even better yet for 80% of Alaska families and doesn’t burden the top 20% any more than any other income bracket. All income brackets would bear the same burden.
Perhaps now that HB 142 is serving to highlight the regressivity of SB 107 and other PFD-based approaches, some will realize it’s time to consider a flat tax as an even more equitable approach to paying for Alaska government.
But regardless, SB 107 is “bad” – in the sense that it takes more from the pockets of 80% of Alaska families, including “lower-income Alaskans and women,” than any of the other revenue alternatives.
Literally, any other revenue approach is better for Alaska families.
Brad Keithley is the Managing Director of Alaskans for Sustainable Budgets, a project focused on developing and advocating for economically robust and durable state fiscal policies. You can follow the work of the project on its website, at @AK4SB on Twitter, on its Facebook page or by subscribing to its weekly podcast on Substack.


