While not yet published at the time we are writing this, for those that follow these things closely the headline from the upcoming Spring 2023 Revenue Forecast (Spring Forecast) is already clear. While oil prices for the current fiscal year (FY23) remain largely on track with those projected in the previous, Fall 2022 Revenue Sources Book (Fall22 RSB) forecast, oil prices – and thus, unrestricted general fund (UGF) revenues – for the next fiscal year (FY24) and beyond are down materially.
As a subheadline, we anticipate projected ANS production volumes also will reflect a small decline, at least for FY23, if not also for FY24 and beyond.
We have a good feel for what will be reflected in the Spring Forecast because we follow the component parts closely in our weekly charts. Our weekly, Friday morning charts for example look at oil prices and their impact on traditional UGF revenue levels. Here is our most recent look at oil prices, published earlier today (March 17, 2023), over the same, upcoming 10-year period that will be covered in the Spring Revenue Forecast:
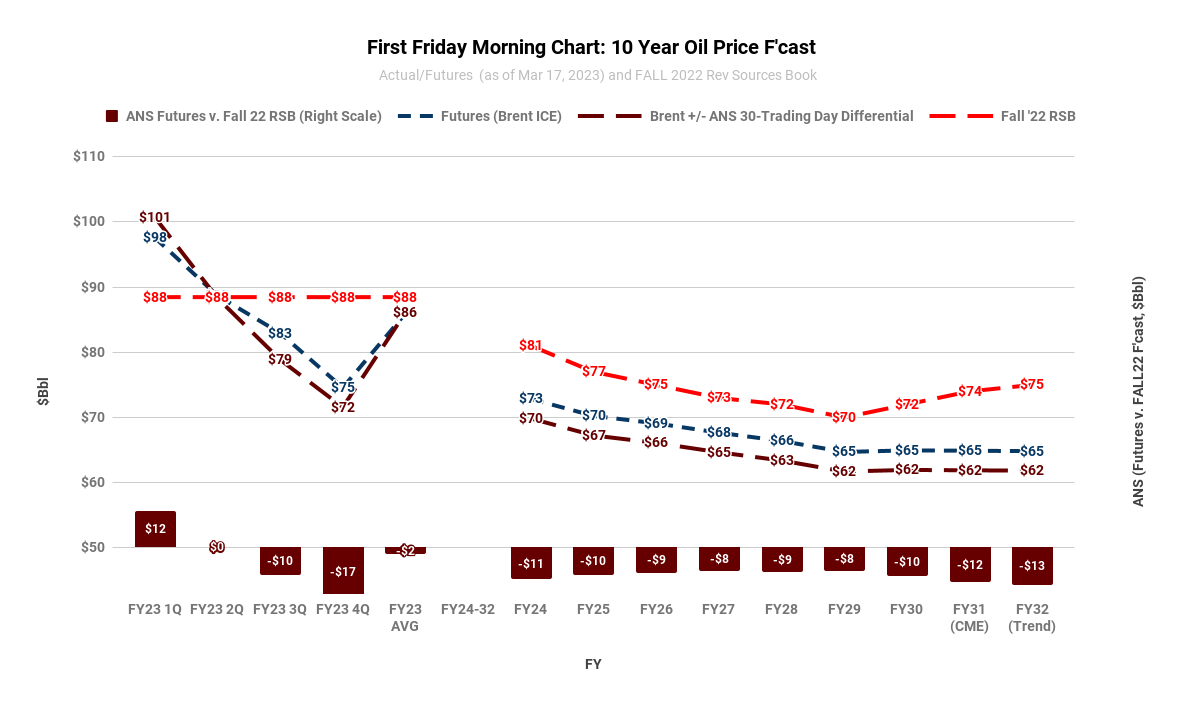
That chart shows the most recent state oil price forecast (in this case, the Fall22 RSB) in red, the most recent oil futures prices for Brent in blue, and, from that, our projection of ANS prices, calculated by adjusting the Brent prices for the recent price differentials between Brent and ANS, in maroon. The bars at the bottom reflect the difference between the state oil price forecast and our projection of ANS prices.
Using the Department of Revenue’s (DOR) most recent price sensitivity matrix, we then calculate from that chart projected traditional UGF revenue levels for the same time period. Here is our most recent look at those, again published earlier today (March 17, 2023):
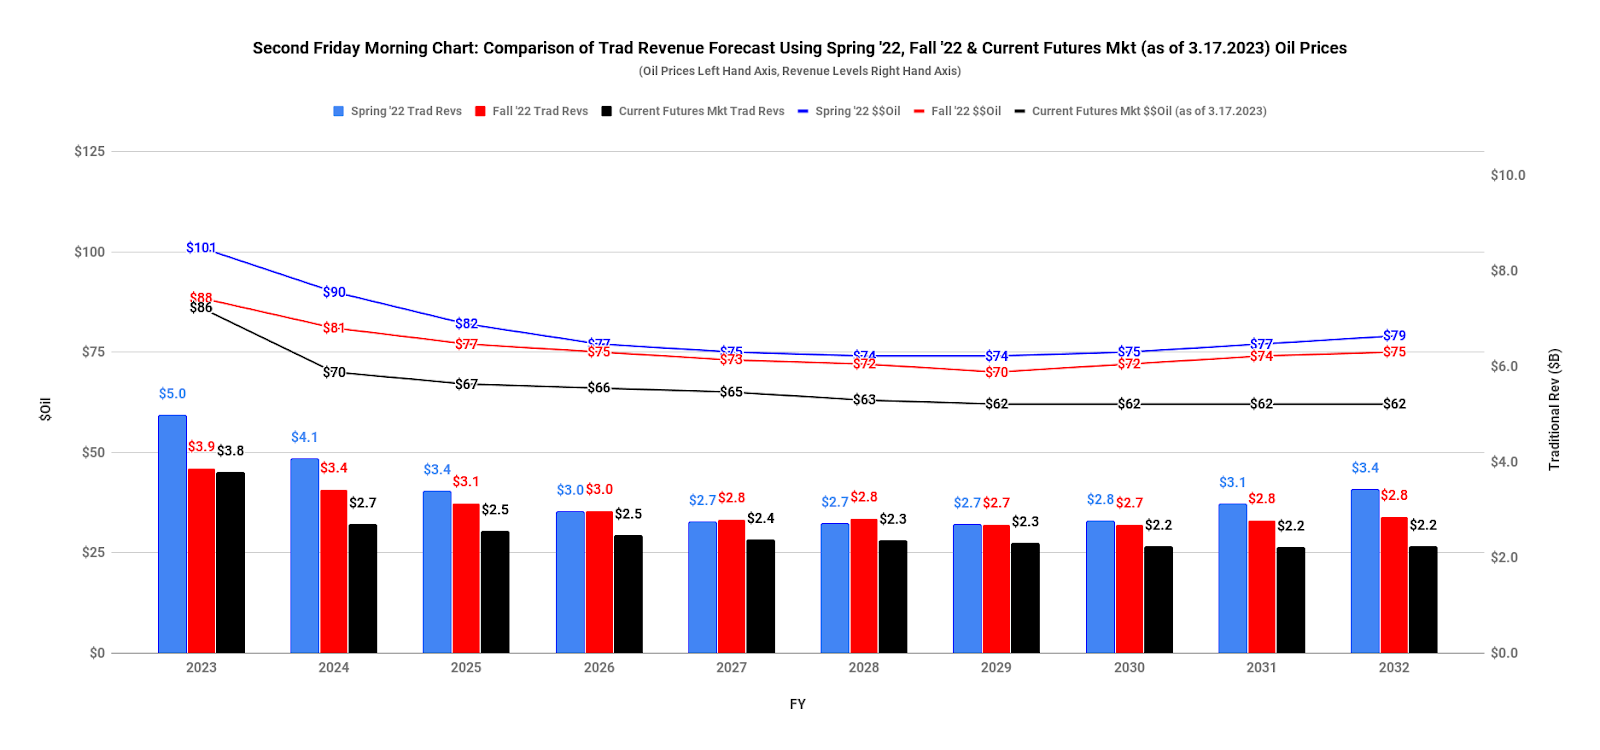
This chart begins by showing as lines at the top the ANS prices projected in last year’s Spring 2022 Revenue Forecast in light blue, the ANS prices projected in the Fall22 RSB in red, and our most recent projection of ANS prices, calculated in the previous chart, in black. Using those, the bars show the traditional UGF revenues resulting from each. Again, those projected in the Spring 2022 Revenue Forecast are in light blue, those projected in the Fall RSB are in red, and those derived from our most recent projection of ANS prices are in black.
As with the oil prices, the bars show that while currently projected traditional UGF revenues for FY23 are on track to finish even with, or at least close to those projected in the Fall22 RSB, the current projections for FY24 and beyond are materially below those projected in the Fall22 RSB.
To determine the full amount of UGF revenues available under current law, we add to the traditional revenues calculated above the current projection of the additional UGF revenues resulting under current law (after the statutory PFD) from the percent of market value (POMV) draw from the Permanent Fund.
These numbers, in gold in the following chart, are derived from the most recent projections of both the POMV draw and statutory net income (SNI, used to calculate the PFD) made by the Permanent Fund Corporation (PFC). We include the results weekly in the first of our three Friday afternoon “Goldilocks” charts. Here is the revenue line from this afternoon’s (March 17, 2023) chart.

While there are slight differences between the PFC’s POMV and SNI levels underlying the revenue projections contained in the Fall22 RSB and currently, they aren’t significant enough to change the overall current law POMV UGF revenues projected between the two periods. The drop in UGF revenues between the two periods is almost entirely due to the decline in oil prices.
As we noted earlier, we also anticipate some reduction in ANS production levels included in the Spring Revenue Forecast.
Each Thursday we chart actual production volumes for the year against those forecasted in the latest state projections. Here’s our most recent analysis (published March 16, 2023):

Using the slope of last year’s production curve as a baseline, this chart plots the volumes projected in the Fall22 RSB by month in the dashed blue line, and the rolling average in the dashed red line, compared to the actual volumes realized by month in the solid blue line and the actual rolling average in the solid red line.
As is clear, with the exception of July, actual FY23 volumes thus far consistently have fallen below those projected over the course of the year.
Separately, each Thursday we also calculate the average amount which would need to be produced over the remainder of the year to achieve the average production levels projected in the Fall22 RSB. Here’s our most recent analysis (published March 16, 2023):

As is clear, to achieve the average level projected in the Fall22 RSB, production over the remainder of the year would need to realize an average level significantly higher than that realized during any month to date. We believe that is unlikely over the remainder of the fiscal year, which beyond this point typically reflects declining volumes as the temperatures on the North Slope rise.
As a result, we believe the Spring Revenue Forecast will reflect a downward revision in projected FY23 production levels. Because of their relationship, we will not be surprised to see similar revisions rolled through in FY24 and subsequent years as well.
What do these numbers tell us?
They tell us that, while it will continue to be close, the state remains on track to achieve (or nearly achieve) the overall revenue levels projected in the Fall22 RSB for FY23. While recent oil prices and the futures for the remainder of FY23 remain significantly below the average level projected in the Fall22 RSB, they are adequately (or nearly adequately) offset by the substantially above-average price levels achieved in the first three months of the fiscal year.
But they also warn us there are significant, indeed huge, problems ahead. In a period during which there is significant upward pressure on future spending levels, the numbers tell us that current law UGF revenues are on track to decline by roughly 20%, from a projected $4.5 billion in FY23 to $3.6 billion by FY32.
In FY24 alone – the year for which the Legislature is budgeting now – year-over-year current law UGF revenues are projected to decline by roughly 16%, to $3.8 billion.
In short, the numbers tell us that, even if spending remained static, the state’s fiscal gap would be growing throughout the entire period due to the decline in revenues alone.
But as we noted in last week’s column, there is little appetite for state spending to remain static. As this session has evolved, even Governor Mike Dunleavy (R – Alaska) is pushing for spending increases, at least in select areas. The question isn’t “if” spending grows, it’s “by how much.”
Thus, the numbers tell us the state’s fiscal situation is only going to get worse going forward.
How much worse?
Because it only deals with revenues, the Spring Revenue Forecast won’t answer that. It will only tell us how much more is added to the gap by additional revenue declines. The overall size of the gap will be controlled by ultimate spending levels.
For those interested, we looked at the various proposed spending levels – and their potential impact on the fiscal gap and through that, on Alaska families – in last week’s column. Even under the “best” scenarios, the fiscal gaps we calculated there are substantial. Because of the continued decline in projected oil prices, the numbers have only gotten worse since then.
To demonstrate, we have superimposed on our earlier chart a dashed red line showing projected UGF spending resulting from the “Stedman $1,300 PFD” approach we discussed in last week’s column.
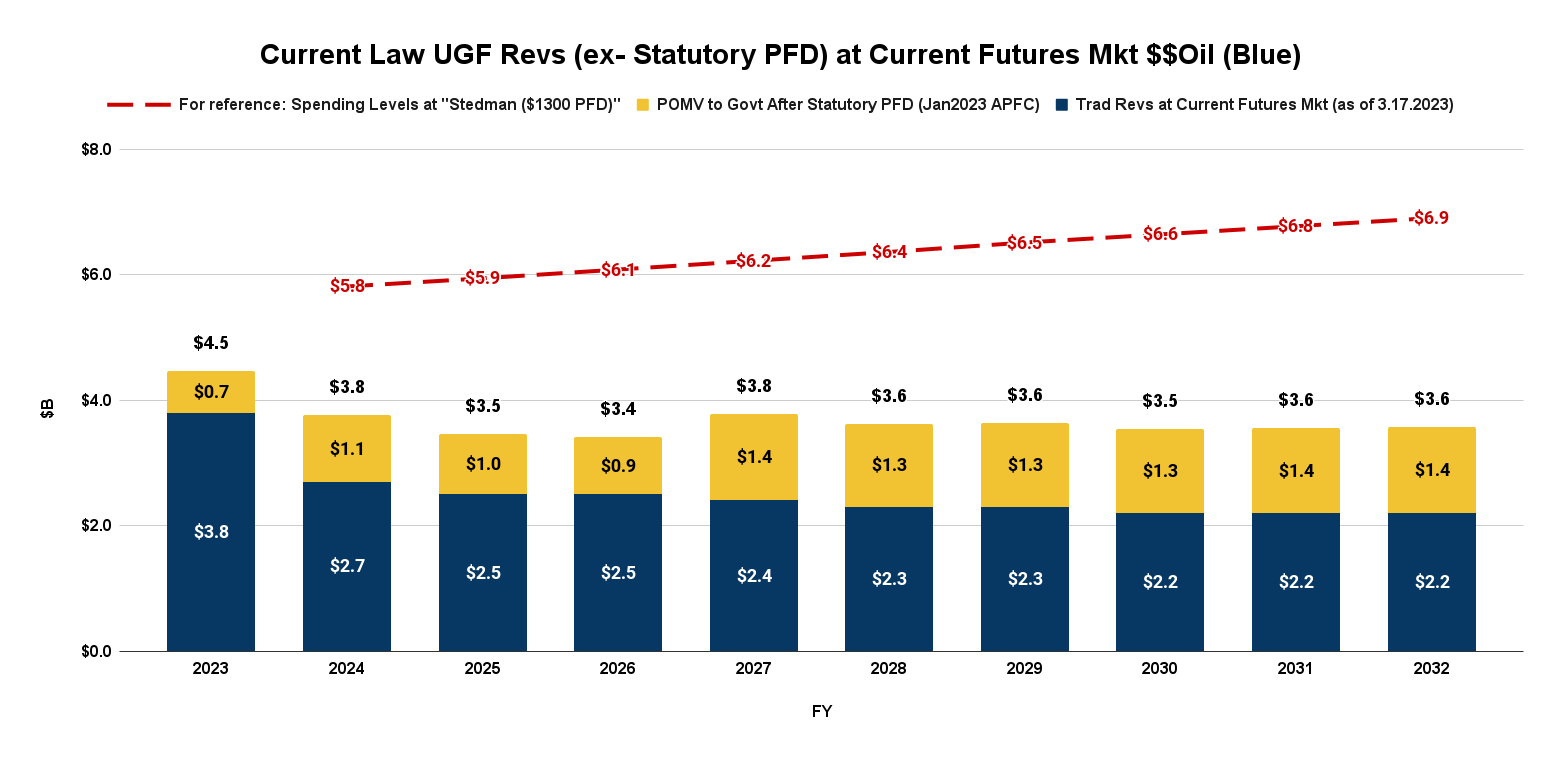
As the chart makes clear, especially when compared to projected spending levels the revenue cavalry not only is not coming over the hill, it is in full-scale retreat. Significant, indeed, potentially huge, taxes in some form – either heavily regressive “head taxes” through additional PFD cuts, or some other, more equitable and lower impact alternative – will be required to fill the coming gaps.
For those interested, we close this week’s column with a couple of additional charts. As we started thinking about this subject we decided to take a look back at how views of FY24 have evolved over time. The first chart is the level of current law UGF revenues projected over time in each of the previous Spring and Fall revenue forecasts that have included the year. The results say a lot about how variable – indeed, flaky – the state’s revenue projections are, even when focused on the same year.
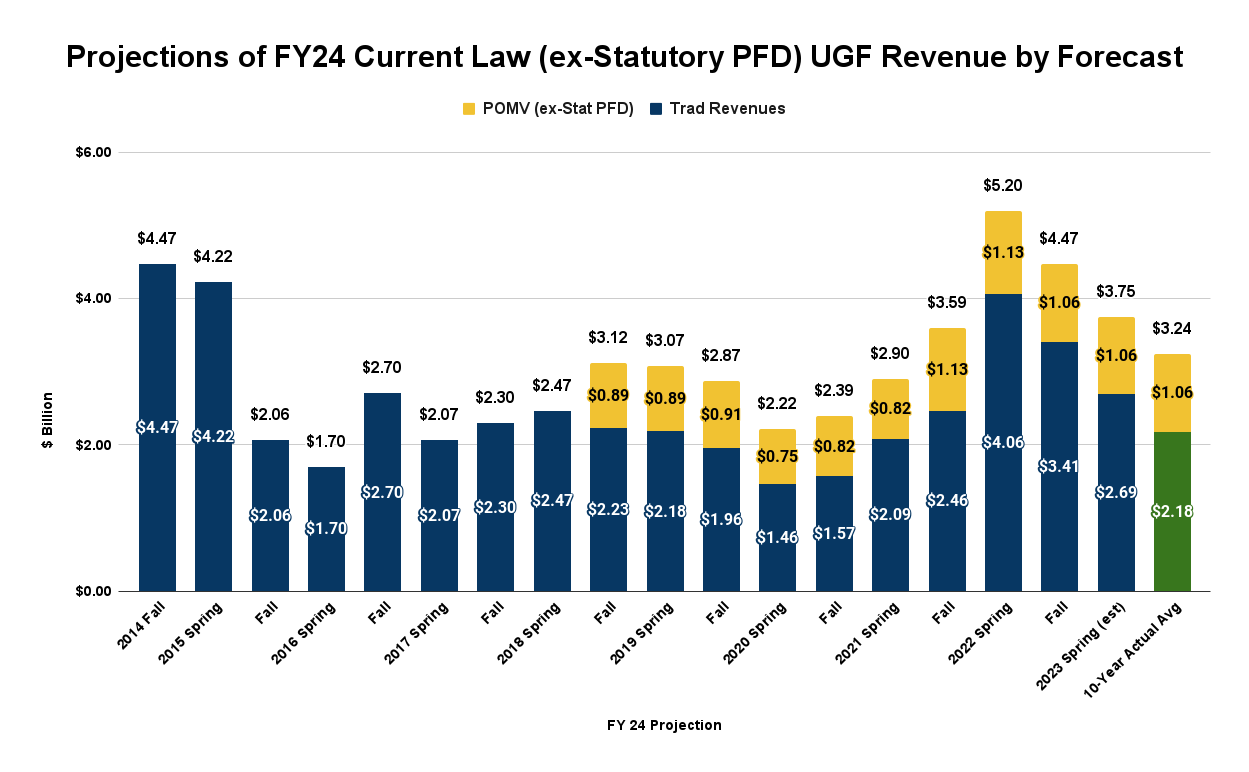
While we would like to say that the revenue projections become “tighter” (i.e., closer to the final used for budgeting purposes) the nearer in time to the beginning of the relevant fiscal year, that’s not true. Just one year ago, in the Spring 2022 Revenue Forecast, DOR projected traditional revenues of $4.06 billion, and total current law UGF revenues of $5.2 billion, nearly 40% higher than those likely to be reflected in this year’s Spring Revenue Forecast, which will be used to actually budget FY24.
In fact, the closest previous projection to the level of FY24 traditional revenues likely included in the Spring Revenue Forecast is that from the Fall 2016 Revenue Sources Book and the closest previous projection to total current law UGF revenues is that from the Fall 2021 Revenue Sources Book.
We have also included in the above chart as the last bar on the right the FY24 traditional revenue projection (in green) that would be made if the state adopted the “10-year averaging, with sideboards,” approach we suggested in a previous column. For the reasons we outline there we continue to believe it would serve as a much better baseline for budgeting than the present, “pin the tail on the price donkey” approach we use currently.
The second additional chart we developed is the same, historical retrospective on production level projections.
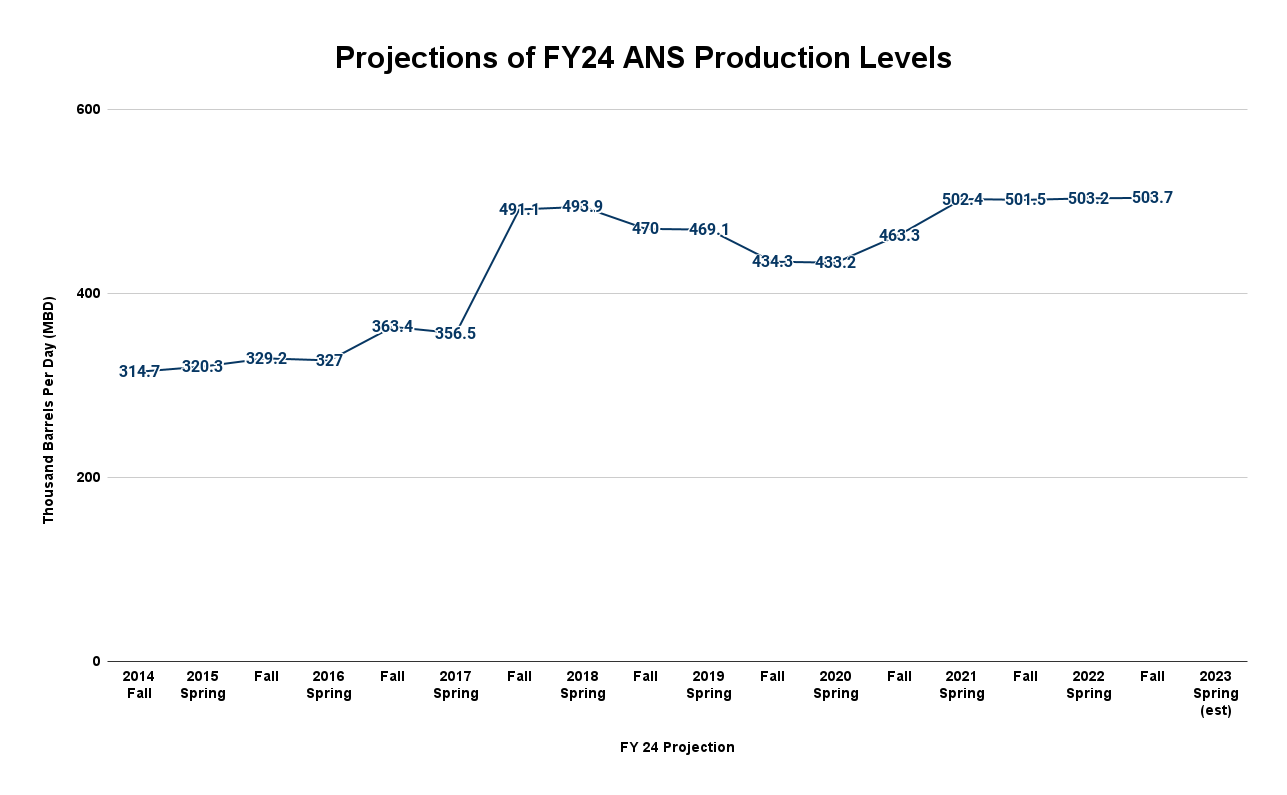
Because changes in production levels generally occur more gradually than changes in oil price levels, the expectation that the projections become “tighter” the nearer in time to the beginning of the year appears to apply.
As we indicated earlier, we have written this column before the actual Spring Revenue Forecast is published by DOR. While typically published on March 15 of each year, it appears to be lagging this year. If significant, we will discuss any differences between the projections made here and the numbers included in the final, published version in a subsequent column.
Brad Keithley is the Managing Director of Alaskans for Sustainable Budgets, a project focused on developing and advocating for economically robust and durable state fiscal policies. You can follow the work of the project on its website, at @AK4SB on Twitter, on its Facebook page or by subscribing to its weekly podcast on Substack.


