While many Alaskans believe that Alaska’s revenue stream, which funds both government and Permanent Fund Dividend (PFD) distributions, lives or dies based on oil revenues, the fact is that revenues drawn from the Permanent Fund (Fund) are far more important.
Over the projected 10-year period included in the Department of Revenue’s most recent revenue forecast (Fiscal Years 2026 – 35), unrestricted revenues from oil are projected to average $1.76 billion per year. On the other hand, revenues from the Fund, realized through the annual statutory percent of market value (POMV) draw, are projected to average $4.37 billion annually, or 2.5 times higher than from oil.
Yet, despite that, while many Alaskans follow and have opinions on oil prices, royalties, and oil taxes, the ways in which the state derives revenues from oil, very few even follow, much less have thought about the investment strategy used by the Permanent Fund Corporation (PFC), the way in which the state ultimately generates revenues from the Fund.
That is unfortunate. The fact is, while we agree the state is leaving money on the table from the way it derives revenues from oil, we have come to believe that the state is leaving even more on the table from the way the PFC manages the Fund’s investment strategy. As we have explained in previous columns, we believe the state is currently leaving somewhere in the neighborhood of $500 million annually on the table in oil revenues. That translates into about $800 per PFD, or $2,100 per average-sized Alaska household. Especially to middle and lower-income Alaska households, that’s a lot.
But as we explained in a column last month, we believe the state is leaving even more on the table – currently, somewhere in the neighborhood of $700 million annually – in potential POMV revenues. That translates into about $1,100 per PFD, or $2,900 per average-sized Alaska household.
The PFC wants Alaskans to believe it is doing a great job. In a recent release, the PFC patted itself on the back for the Fund balance hitting an “all-time high.” In an op-ed appearing in most of the state’s papers over the last few weeks, the PFC’s Executive Director lauds the PFC’s “diversified” investment strategy.
But neither the release nor the op-ed includes actual numbers comparing the PFC’s performance to alternatives, nor quantifying the cost of its “diversified” investment strategy.
That’s likely by design. The most recent, detailed numbers covering both, released at the end of last month, show that the PFC’s performance is increasingly dismal compared to the alternatives, and that the cost of its “diversified” investment strategy is staggering and self-defeating.
Let’s start with performance.
As some readers will realize, monthly, after the PFC publishes its updated results, we compare the returns achieved by the PFC against several alternatives. Two are benchmarks created by the PFC. The first is its “Performance Benchmark,” which, according to the PFC, is “a blend of indices reflective of the Board’s target asset allocation. Comparison of actual performance to this benchmark measures how effectively staff has implemented the Board’s plan for the Fund.”
The second is its “Passive Index Benchmark,” which, again according to the PFC, is “a blend of passive indices reflective of a traditional portfolio consisting of public equities, fixed income, and real estate investments. Outperformance of the Total Fund versus this Passive Index Benchmark is representative of the value-added by APFC staff in generating higher returns through active asset allocation and portfolio management.”
The third performance measure published by the PFC is its “Total Fund Return Objective.” Again, according to the PFC, “the Board’s long-term investment goal for the Fund is to achieve an average real rate of return of five percent (CPI+5%) per year. It is recognized that there may be years, or a period of years, when the Fund does not achieve this goal, followed by years when the goal is exceeded. Yet, over one or more business cycles, the Board seeks to achieve an average annual real rate of return of five percent (CPI+5%) at risk levels broadly consistent with large public and private funds.”
The PFC’s “Total Fund Return Objective” is also important for another reason. The Legislature’s annual POMV draw is also based on 5% of the Fund’s balance, averaged over time. As a result, the PFC’s performance against the Total Fund Return Objective is a useful indicator of whether the PFC is generating enough of a return to adequately fund the POMV draw.
In its monthly reports, the PFC calculates the results over a number of periods, including on a rolling 5-, 3-, and 1-year average basis, as well as for the current fiscal year to date. Those are the periods chosen by the PFC to reflect the “business cycles” over which its performance should be evaluated.
To those we have added in our charts the performance over the same periods of the Vanguard S&P 500 Electronic Traded Fund (ETF), a low-cost way of investing in Standard & Poor’s 500 Index, “which is considered a gauge of overall U.S. stock returns.” We calculate the returns achieved from the ETF by using the tool available at TotalRealReturns.com, which permits us to include the compounding value realized by reinvesting the dividends produced from the stocks.
While not exact, the results closely approximate what would be achieved by implementing the so-called “Buffett 90/10 investment rule.” That approach, named after the legendary investor, Warren Buffett, is composed of a portfolio that invests 90% of the funds in a low-cost S&P 500 index fund and the other 10% in short-term government bonds. According to Buffett, the mix achieves long-term growth at a reasonable level of risk.
While some view an approach weighted toward equities as risky, in Buffett’s view, the risk of using an S&P 500 ETF is substantially moderated by the broad diversification of the S&P 500 and the quality and size of the companies it includes. According to Buffett, because of that and its low costs, “long-term results from this policy will be superior to those attained by most investors—whether pension funds, institutions, or individuals—who employ high-fee managers.”
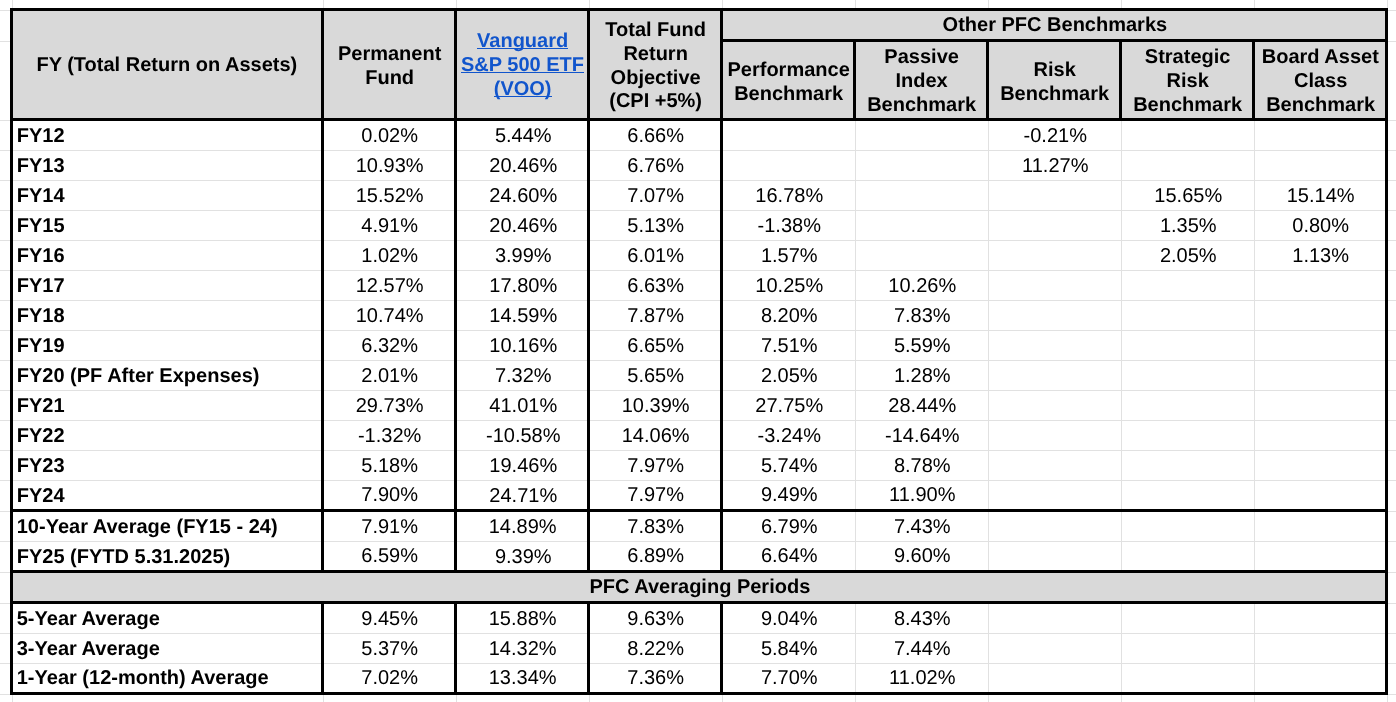
Here is the result, with all of the numbers taken directly from the PFC’s own reports, except for those for the Vanguard ETF, which are calculated from the page for that product at TotalRealReturns.com.

Compared against its own, self-created benchmarks, the PFC’s performance seems reasonable when viewed on a rolling 5-year average basis. The return achieved by the PFC exceeds both its own performance and passive index benchmarks.
However, even compared to its own, self-created benchmarks, the PFC’s performance pales when viewed on rolling 3-year and 1-year averages. The PFC’s actual return comes in below both its own performance and passive index benchmarks for both periods.
The PFC fares even worse when compared to its own “Total Fund Return Objective” and the external, Buffett-rule approach represented by the Vanguard S&P 500 ETF. The PFC’s actual return falls below the Total Fund Return Objective on all three of the 5-year, 3-year, and 1-year rolling averages.
Consistent with Buffett’s expectation that his approach produces returns which are “superior to those attained by most investors—whether pension funds, institutions, or individuals—who employ high-fee managers,” the PFC’s performance pales even further compared to the Buffett rule approach. The Buffett rule approach produces returns which are 68% higher than the PFC’s on a 5-year rolling average, 167% higher on a 3-year rolling average, and 90% higher on a 1-year rolling average.
What does that mean for Alaskans?
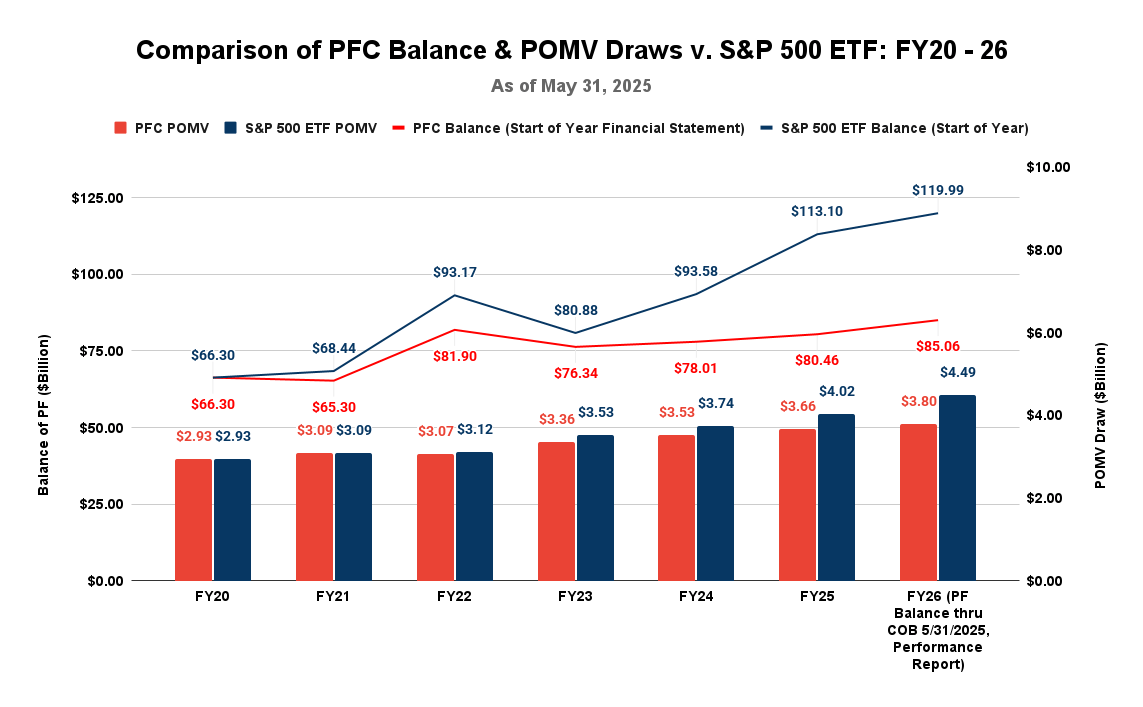
As we discussed in a column last month, we chart the impact monthly, comparing the differences in the balance of the Fund and the POMV draw between the PFC’s actual returns and what they would have been had the PFC adopted the Buffett approach beginning in Fiscal Year (FY) 2020. Here is the latest chart, reflecting results over the same period in the chart above.

The numbers are clear. If the PFC had used the Buffett-rule approach instead of its own since the beginning of FY20, the current balance of the Fund would be nearly $35 billion (41%) higher, and this coming fiscal year (FY26)’s POMV draw would be nearly $700 million (18%) greater.
Those are substantial differences, with the returns generated using the PFC’s current approach looking dismal by comparison.
The costs the PFC is incurring in producing those returns under its approach are similarly dismal.
In his recent op-ed, the Executive Director of the PFC praises what he calls the “diversified” approach the PFC takes in managing the Fund. However, he fails to discuss the costs the PFC incurs in pursuing that approach or compare it to the alternatives.
Every quarter, the PFC produces what it calls a “Management Fee Report” that totals the payments it made for what it classifies as the “investment management fees” and “profit sharing/performance” during a previous quarter. The amounts are stated both in raw dollars and in “basis points,” which essentially are fractions of a percent of the dollars the PFC has “under management,” i.e., is investing.
The reports are published substantially in arrears. For example, the latest report, published near the end of June, only covers the amounts paid during the first calendar quarter of 2025, ending in March. As a result, it is difficult to get a real-time handle on what is being spent.
But restating everything to the date of the report provides some eye-opening insights into the general trends.
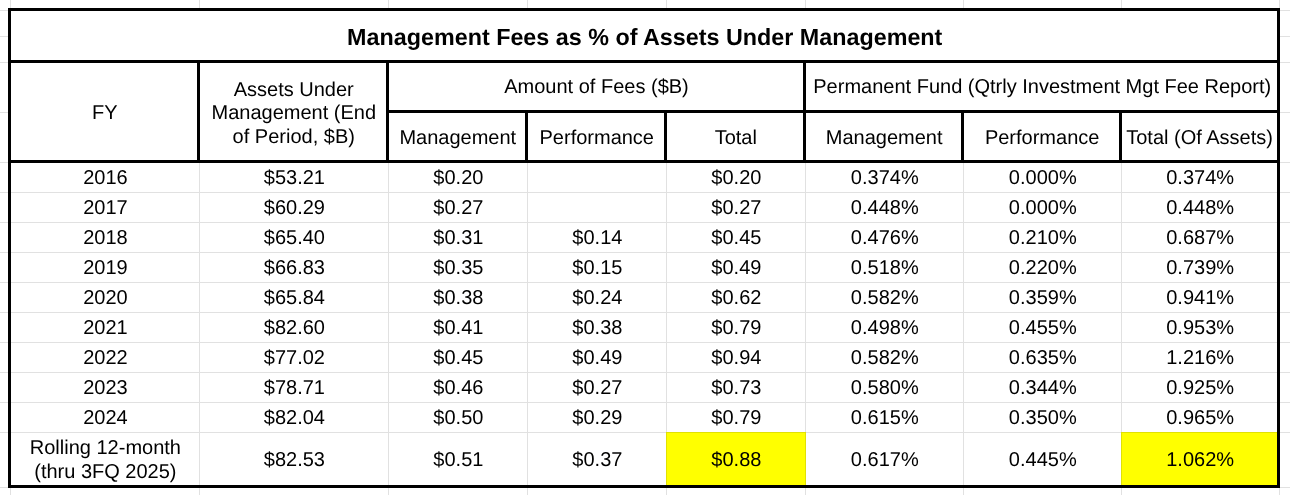
Here is a chart we update quarterly showing the amount of the assets under management as of the end of the fiscal year, or in the case of the most recent report, the previous 12-months, together with the amount of fees paid over the period by category, both in terms of raw dollars as well as a percent of the assets under management, a standard tool used for comparing results across funds.

As the chart shows, over the most recent 12-month period for which the PFC has published results, it has paid $880 million in total fees, which represent over 1% of the assets under management.
To evaluate the reasonableness of payments at that level, we compare that amount to the amounts published for the similar management costs of the Norwegian Government Pension Fund Global, often referred to as the “Norway Fund,” which is widely considered the gold standard among sovereign wealth funds.

The differences are staggering. Over the past nine years, the amounts spent by the PFC, measured as a percent of assets under management, have escalated from an already significant seven times more than those paid for the Norway Fund to more than 23 times more. And the latter comparison is based on the year ending 2024 for each. Subsequently, the PFC’s costs have grown by nearly another ten basis points, from .965% to 1.062% for the most recent rolling 12 months. That increase alone is nearly double the total amount of fees, measured as a percent of assets under management, annually incurred by the Norway Fund over the past four years.
We also look at the costs incurred by the PFC in a second way.
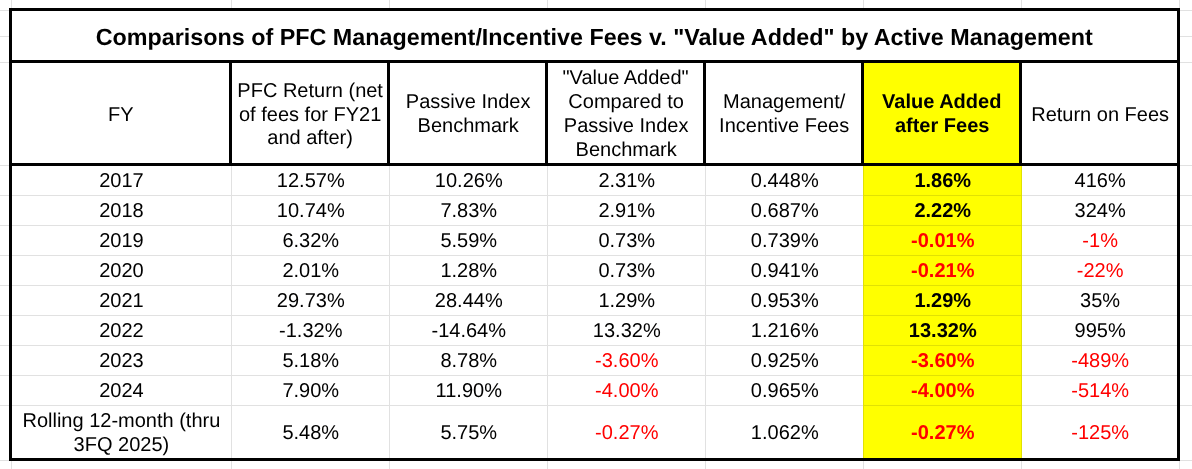
Recall that as one of its self-selected benchmarks, the PFC publishes a “passive index benchmark,” which is designed to represent a baseline against which to measure the “value-added by APFC staff … through active asset allocation and portfolio management.” Using that baseline, we measure both the actual value added and the return on the fees paid as part of that “active asset allocation and portfolio management.”

The numbers tell an important story. Over the past eight years, since the PFC has started publishing its self-selected passive index benchmark, the PFC has “overperformed” – i.e., beat the benchmark – only half the time, and is well on its way to “underperforming” yet another.
If the management and incentive fees are viewed as an investment, the return on that investment has been hugely inconsistent. Especially viewed in light of the differences between the PFC’s results and those which would have been achieved had the PFC followed the passive, “Buffett rule” approach, the numbers are crystal clear that the Fund – and through it, Alaskans – would have been much better off if the PFC had saved the billions spent on the fees and invested them instead in additional return generating assets, such as the Vanguard S&P 500 ETF.
Buffett is right: His approach produces returns which are “superior to those attained by most investors—whether pension funds, institutions, or individuals—who employ high-fee managers.”
The numbers are clear. The PFC is significantly underperforming in managing Alaska’s most important fiscal asset. In doing so, it is costing Alaskans a substantial amount of additional revenue. The only ones making money are the “high-fee managers” being paid with Alaskans’ money.
No amount of rhetoric, whether in the form of press releases or op-eds, changes those results.
Just as they are with oil revenues, Alaskans concerned about the state’s fiscal situation should push for significant changes at the PFC. We are and hope others will continue to join us.
Brad Keithley is the Managing Director of Alaskans for Sustainable Budgets, a project focused on developing and advocating for economically robust and durable state fiscal policies. You can follow the work of the project on its website, at @AK4SB on Twitter, on its Facebook page or by subscribing to its weekly podcast on Substack.


Based on Norway’s own website their returns have been 6.3% annually since inception and 7.25% in the past 10 years. Fund returns | Norges Bank Investment Management Based on APFC’s disclosures as reported in the Financial Times the return over the past 10 years is 8.4% annually. Swagger of Wall Street titans masks their servant status The average performance of Target Date funds used in many 401(k)s is 6.6% annual return. How the Right Target-Date Fund Could Make You $400,000 Richer – Barron’s How does this compare to your last 10 years of annual returns in your retirement account? I’d… Read more »