Over the past couple of weeks, the Permanent Fund Corporation (PFC) has published most of the reports that reflect, on a preliminary basis, its results for Fiscal Year 2025. The purpose of this week’s column is to look at them in the context of the other columns we have recently written on the PFC’s performance.
Overall, the PFC is likely to claim that FY25 was a success. According to their preliminary Monthly Performance Report for June, the PFC achieved a 9.35% return for the year, the highest for them since the extraordinary COVID-driven year of FY2021 (during which they achieved a 29.73% return) and before that, since FY2018 (10.74%).
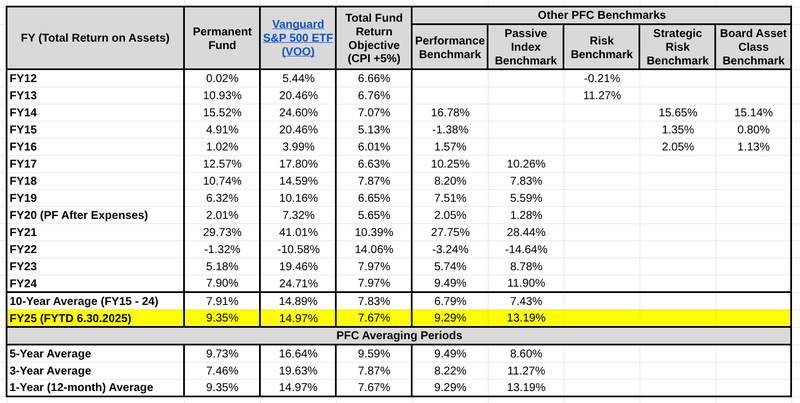
But that number alone doesn’t tell analysts much. It needs to be viewed in the context of the overall market. Using one of our usual month-end charts, here’s how that return compares to others.

Looking at the highlighted line, while the 9.35% compares favorably to recent years and exceeds both the PFC’s “Total Fund Return Objective” and “Performance Benchmarks,” it falls well short of both the PFC’s own “Passive Index Benchmark” (13.19%) and the results for the same period of the Vanguard S&P 500 Exchange Traded Fund (ETF) (14.97%).
When averaged over three years with prior results, the PFC’s performance (7.46%) still trails not only the PFC’s Passive Index Benchmark (11.27%) and the Vanguard S&P 500 ETF (19.63%) for the same period, but also the PFC’s Total Fund Return Objective (7.87%) and Performance Benchmarks (8.22%).
The PFC’s performance improves when considering a 5-year average, where it (9.73%) surpasses all three of its own benchmarks, but still significantly lags behind the Vanguard S&P 500 ETF (16.64%) for the same period.
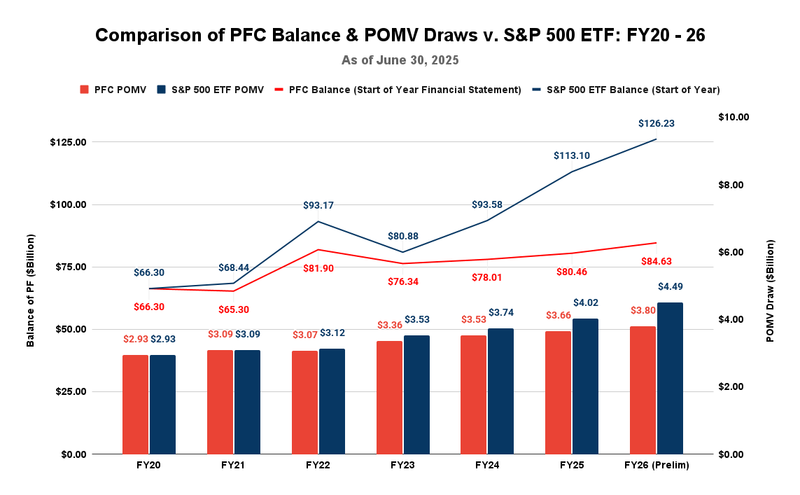
The long-term underperformance of the PFC compared to the Vanguard S&P 500 ETF is also shown by comparing the annual balance of the Permanent Fund and the level of annual POMV draws against what they would have been if invested in the S&P 500 at the start of FY20.

According to the PFC’s Preliminary Financial Statement for June, the balance of the Permanent Fund reached an all-time high of $84.63 billion as of the end of FY25, and is positioned to generate an all-time high POMV draw of $3.8 billion for FY26. But those numbers pale compared to the S&P 500 ETF proxy.
As the chart reflects, at $126 billion as of the end of FY25, the balance of the S&P 500 ETF proxy is nearly 50% higher than the PFC’s, and at $4.5 billion, the POMV draw would be almost 20% higher than what the PFC is generating.
Viewed annually, the Vanguard S&P 500 ETF has outperformed the PFC every year of the period except one (FY22), generating a compound annual growth rate in the balance of the account over the period of 11.3% compared to only 4.2% for the PFC. While, because of the 5-year averaging approach, the growth of the POMV draw using the S&P 500 ETF approach has been at a slower pace, its compound annual growth rate over the period of 7.4% still outperforms the 4.4% for the PFC.
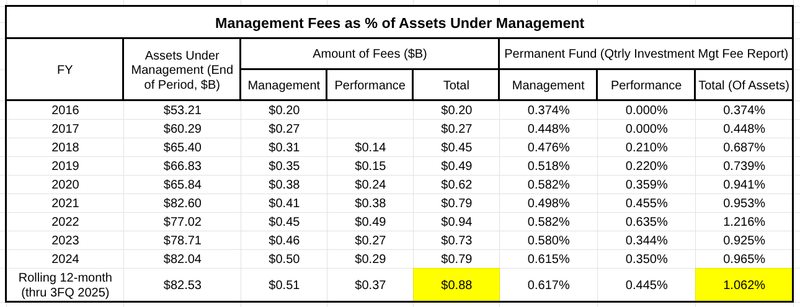
In addition to outperforming the PFC’s investment approach, the S&P 500 ETF is also significantly cheaper to operate. While the PFC has not yet updated its Management Fee Report for the results through the end of FY25, we can estimate the fees the Fund has incurred for the period by using the running 12-month balance as of the end of the Permanent Fund’s third fiscal quarter.
As we explained in a prior column, based on the running 12-month balance as of the end of the Permanent Fund’s third fiscal quarter, the PFC is incurring approximately $880 million annually in management and performance fees, or an amount equal to roughly 1.06% of its assets under management. That compares to an annual “expense ratio,” or the fees charged to investors to cover an ETF’s operating costs, of approximately .03% for the Vanguard S&P 500 ETF. Even on the higher balance achieved by the S&P 500 ETF, the fees on that approach would still total only about $38 million annually, or 4.3% of the fees being paid by the PFC.
The lower cost approach comes well recommended. As Warren Buffett said in his famous 2013 letter to shareholders, “both individuals and institutions will constantly be urged to be active by those who profit from giving advice or effecting transactions. The resulting frictional costs can be huge …. So ignore the chatter, keep your costs minimal. [Instead,] put 10% of the cash in short-term government bonds and 90% in a very low-cost S&P 500 index fund. (I suggest Vanguard’s.) I believe the … long-term results from this policy will likely be better than those achieved by most investors—whether pension funds, institutions, or individuals—who hire high-fee managers.
As the Investopedia article on Buffett’s 90/10 approach explains: “Because of compounding, even slight differences in annual fees can add up to significant differences in portfolio size over time—thousands or even tens of thousands of dollars on a modest initial investment. An S&P 500 index fund should keep fees to the bare minimum.”
The PFC’s results are a real-world demonstration of the significant impact an “active” approach involving “high-fee” managers can have. Here are the fees that the PFC has reported over the years in its quarterly Management Fee Reports.

Over the 10-year period, the fees total more than $6 billion, or about 20% of the Fund’s roughly $30 billion in growth over the period.
Applying the same ratio of Vanguard’s S&P 500 ETF expense ratio to the fees incurred for the rolling 12-month period through the third quarter of FY25, the comparable number in fees using the lower cost approach recommended by Buffett over the period would be approximately $250 million, or roughly 0.8% of the Permanent Fund’s growth over the period.
Looked at another way, even using the current balance as a starting point, the Permanent Fund’s balance would be over $90 billion by now if the PFC had used an ETF approach rather than relying on, to borrow Buffett’s term, “high-fee managers.”
In sum, viewed from the perspective of the PFC’s recent past results, it performed reasonably well this year. But the results are well below those that could be achieved using Buffett’s 90/10 approach, and they come at considerable cost in terms of the amount of fees the PFC is incurring to produce them.
They reflect Buffett’s warning: “ … institutions will constantly be urged to be active by those who profit from giving advice or effecting transactions. The resulting frictional costs can be huge …” and the results suboptimal.
Brad Keithley is the Managing Director of Alaskans for Sustainable Budgets, a project focused on developing and advocating for economically robust and durable state fiscal policies. You can follow the work of the project on its website, at @AK4SB on Twitter, on its Facebook page or by subscribing to its weekly podcast on Substack.


Q: do your recommendations (to go 90% S&P 500) come with a time machine? If so, great! Sign us up! If not, well, perhaps things are a big more nuanced than you appear to be suggesting.