One of the biggest challenges in discussing Alaska’s fiscal situation is to persuade listeners to focus on the full fiscal forest.
When discussing fiscal issues, most focus one-at-a-time on various trees, such as spending levels, K-12 spending, oil taxes, Permanent Fund Dividend (PFD) levels, or various other individual pieces that, together, make up the overall forest. But without understanding the overall context in which those trees exist, it’s easy to misunderstand the forces at play in any given issue that might arise.
A good example of that is the current debate over K-12 spending. Many proponents of increased spending focus almost entirely on K-12 spending levels without placing them in the context of overall spending and revenue levels. In doing so, they miss the fact that while overall spending continues to increase, current law revenues continue to fall significantly short of those spending levels and are projected to fall even further behind over the coming decade.
As a result, the debate fails to focus on the equally important questions of whether other spending can be deferred to make way instead for K-12 increases or, if not, how the increased spending should be paid for. To many, all that matters is that K-12 spending should be increased, regardless of what – or who – becomes collateral damage in the process.
To help with providing that context, in this week’s column, we focus on some important aspects of the overall forest, so that those discussing various trees can put the discussion in an overall perspective when they do.
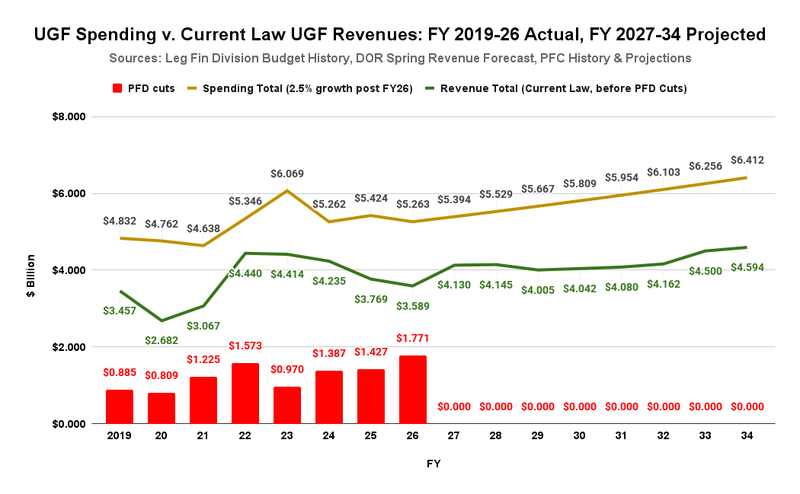
We start with a chart that compares overall unrestricted general fund (UGF) spending to overall UGF revenues provided under current law. Both the revenue and spending numbers exclude PFDs. We exclude them from the revenue numbers because, under current law, the revenue used to pay them is “statutorily designated for [the] specific purpose’ of paying PFDs and as a result, under the rules used by the Legislature’s Legislative Finance Division (LegFin, at footnote 3), qualifies as “Designated general funds” rather than UGF. We exclude them from UGF spending because, again, under current law, the funds are designated to be spent on the specific purpose of paying PFDs.
A portion of the PFD later comes back into the discussion when it is withheld and diverted to close the gap between UGF revenues and UGF spending.

We use FY2019 as the starting point for the chart primarily because it was the first year that the Legislature began using statutory percent of market value (POMV) draws from the Permanent Fund earnings reserve account to help pay for spending. The revenue base in prior years is not comparable and leads to distortions when used across periods. FY2019 also happens to be the first fiscal year over which the Dunleavy administration had some influence, although the administration’s first full budget was for FY2020.
The chart should be eye-opening for those not familiar with the history. It shows that, even with the inclusion of the portion of the POMV draw statutorily designated to help pay for government services, UGF spending (the line in gold) consistently has outpaced revenue (the line in green) between FY2019 and FY2026. It also shows that even with capping future spending growth at inflation throughout the remainder of the current projection period, spending will continue to outstrip revenues well into the future.
We have also included the portion of the PFD which has been withheld and diverted – what University of Alaska – Anchorage Institute of Social and Economic Research (ISER) Professor Matthew Berman calls “taxed” – in various years (the red bar), to help cover UGF spending. As the chart implies, in the absence of additional revenue from other sources, some level of that tax is likely to continue in future years even if overall spending growth is held to the inflation rate. Because there is no statutory basis that establishes the basis for those diversions, however, the level is determined on an ad hoc basis in the course of the annual appropriations process.
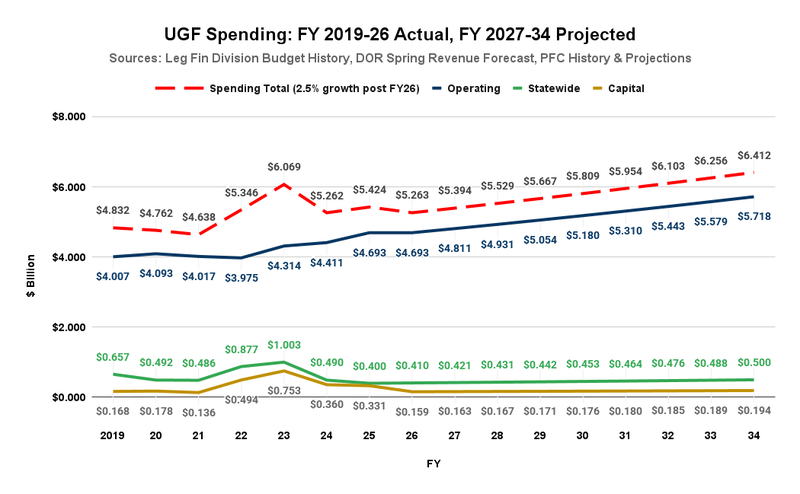
As shown on the following chart, spending levels are determined mainly by the operating budget (the line in blue).

While there are occasional spikes in overall spending caused by short-term increases in statewide (green) or capital (gold) spending levels, the operating budget largely drives the boat. While the operating budget remained relatively flat between FY2019 and FY2022, over the last four years (FY2021 – 25), it has grown at an overall annual compound growth rate of more than 4%. The chart assumes that the growth rate reverts to the projected rate of inflation (2.5%) from FY2026 forward, but there is no statutory guarantee that it will. If it exceeds that, the projected gap between overall spending and revenue levels will be even greater.
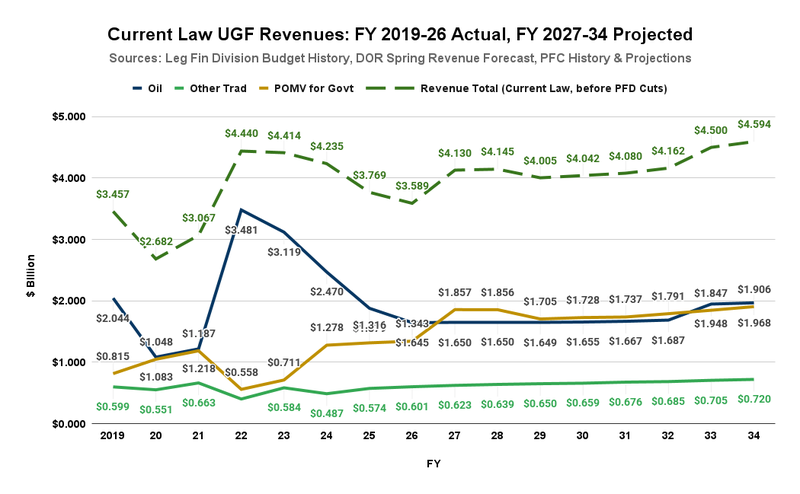
Unlike spending levels, revenues don’t generally follow inflation. Instead, as the following chart shows, they are driven much more by oil royalty and tax revenues (in blue) and, on a lagging basis, through the POMV draws, Permanent Fund return levels.

While occasional spikes in oil royalty and tax revenues produce spikes in overall revenue levels (the green dashed line), as demonstrated by the experiences in FY2022 and FY2023, those are almost immediately absorbed by concurrent spikes in spending levels. The state realizes no significant long-term fiscal policy benefit from them.
While some increase in POMV draws is projected, and oil revenues are projected to rise in the latter stages of the period, for the most part during the coming 10-year forecast period, oil revenues and, with them, overall revenues are projected to lag materially behind the levels experienced in the immediate past (FY2022 through FY2024). As demonstrated on the first chart of this column, the result is growing deficits throughout most of the period.
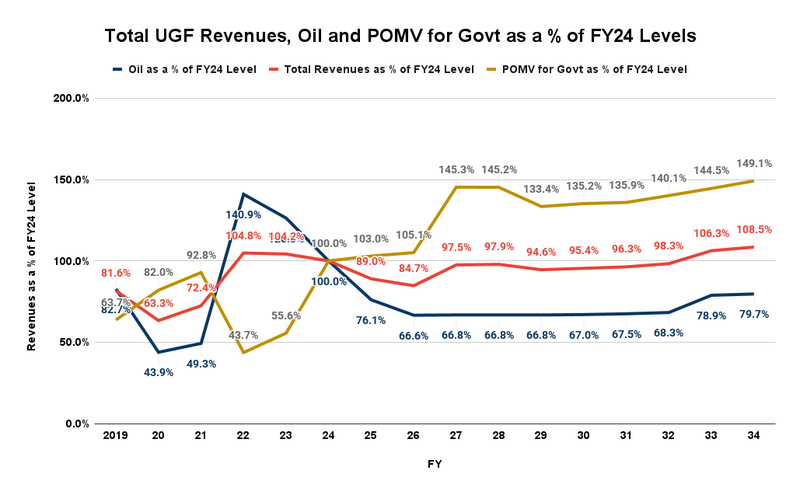
Another way of looking at these issues is to look at the change in spending and revenues over time, measured against a common base year. Here’s a look at spending levels, broken down into overall, combined operating and statewide, and capital relative to a base year of FY2024.

Unlike overall spending, overall revenues (the red line) are projected to decline after FY2024, not recovering to FY2024 levels until much later in the forecast period. While revenues from the portion of the POMV draw statutorily designated for government (in gold) are projected to climb throughout the period, for the reasons we explained in last week’s column, revenues from oil are projected to plunge and remain well below FY2024 levels throughout the projection period. The plunge in oil revenues in turn drives down overall revenues.
What this demonstrates is that, viewed from the perspective of the overall forest, neither those pushing for increased K-12 or any other spending, nor those pushing for reductions in PFD cuts or any other revenue reductions in isolation can claim to be fiscally responsible. If done in isolation, both increase the staggering level of deficits the state is already facing.
To be fiscally responsible when raising their issues, both must be prepared at the same time to push and defend either offsetting revenue increases or reasonable and achievable offsetting spending cuts elsewhere to pay for their proposal.
Brad Keithley is the Managing Director of Alaskans for Sustainable Budgets, a project focused on developing and advocating for economically robust and durable state fiscal policies. You can follow the work of the project on its website, at @AK4SB on Twitter, on its Facebook page or by subscribing to its weekly podcast on Substack.


Grim but realistic assessment. The adults in the legislature (there are some!), know this reflects the fiscal future for Alaska. That said, there isn’t sufficient collective will in the legislature to address this reality. And, Governor Dunleavy hasn’t genuinely engaged in seeking how to address this impending fiscal problem other than occasionally spouting off about the need for saving on travel costs and other small bore solutions. Alaska is motoring straight ahead, bound for a fiscal cliff that we will zip over in about 22 months. It’s likely to be a doozy of a wreck. That prospect is avoidable but… Read more »