We often write about state budget deficits in these columns and elsewhere, expressing concern about the levels and examining alternatives for balancing them.
But as we look back on past columns, we realize we’ve never explicitly discussed one way – in fact, our preferred way – of measuring their size and impact. That is, by measuring the deficit as a percent of Alaska’s adjusted gross income (AGI).
We focus on that measure because it generally tells us how much of a burden the deficit is on overall Alaska family income, a critical factor. As the marginal source of funds, ultimately, it’s Alaska families that bear all or most of the burden of the deficit. The higher the deficit, the more income is diverted out of their hands to government.
And even more importantly, that measure additionally provides a baseline for evaluating the impact of proposals for recovering the deficit on various categories of Alaska families. Various proposals shift more of the burden to some categories of Alaska families than others. We think it is vital for both policymakers and citizens to understand how and to what extent that shift occurs – which Alaska families benefit from various alternatives and which lose.
We discuss how we calculate the measure and the uses we make of it below.
Deficit Levels
To provide some historical context, we start the process by calculating past deficit levels, largely using the “Budget History Data” maintained by the Legislative Finance Division (LFD). As extensive as it is, oddly, that source does not include the size of the statutory PFD after FY2016 (which is needed to calculate the “current law” deficit), but we are able to derive that from the historical data available from the Permanent Fund Corporation.
Based on that data, on the left side of the following chart is the size of the current law deficits (the pink shaded area) from FY2010 through FY2023. The asterisk on FY2015 indicates we adjusted the size of the deficit shown by LFD for that year to exclude the portion attributable to the transfer of $3 billion from the Constitutional Budget Reserve (CBR) to the state’s various retirement systems:

As the chart indicates, by holding spending (the red line) relatively steady during the five-year span from FY2017 through FY2021 (prior to the FY2021 supplemental), the Legislature was able to reduce the size of the deficits, as revenues (the blue line), driven largely by oil prices and draws from the Permanent Fund earnings reserve, somewhat recovered from their nose-dive in the early and mid-teens.
That spending discipline was lost as oil prices temporarily surged in FY2022 and FY2023, however. Rather than maintaining the same, steady level, which potentially could have resulted in some payback to the CBR, spending levels increased in both years.
The portion of the chart on the right side looks at projected deficit levels from FY2024 through FY2032, the current 10-year planning window used by the Office of Management and Budget (OMB), and LFD.
The spending levels are taken from LFD’s “Current Law” baseline included as part of its FY2024 “Legislative Fiscal Analyst’s Overview of the Governor’s [Budget] Request.” As we explained in a previous column discussing our updated “Goldilocks Charts,” the revenues reflect the most recent information about the size of the annual percent-of-market-value (POMV) draw and PFD levels published by the Permanent Fund Corporation and traditional revenues based on current oil market futures prices.
While not to the same extent as occurred in the early and mid-2010s, from a narrowing in FY2021 and FY2022, deficits are projected to start growing again going forward as spending increases while oil prices – and through them, revenues – continue to soften.
The average annual deficit during the period from FY2024 through FY2032 is about $2 billion.
Overall Impact on Alaska Income
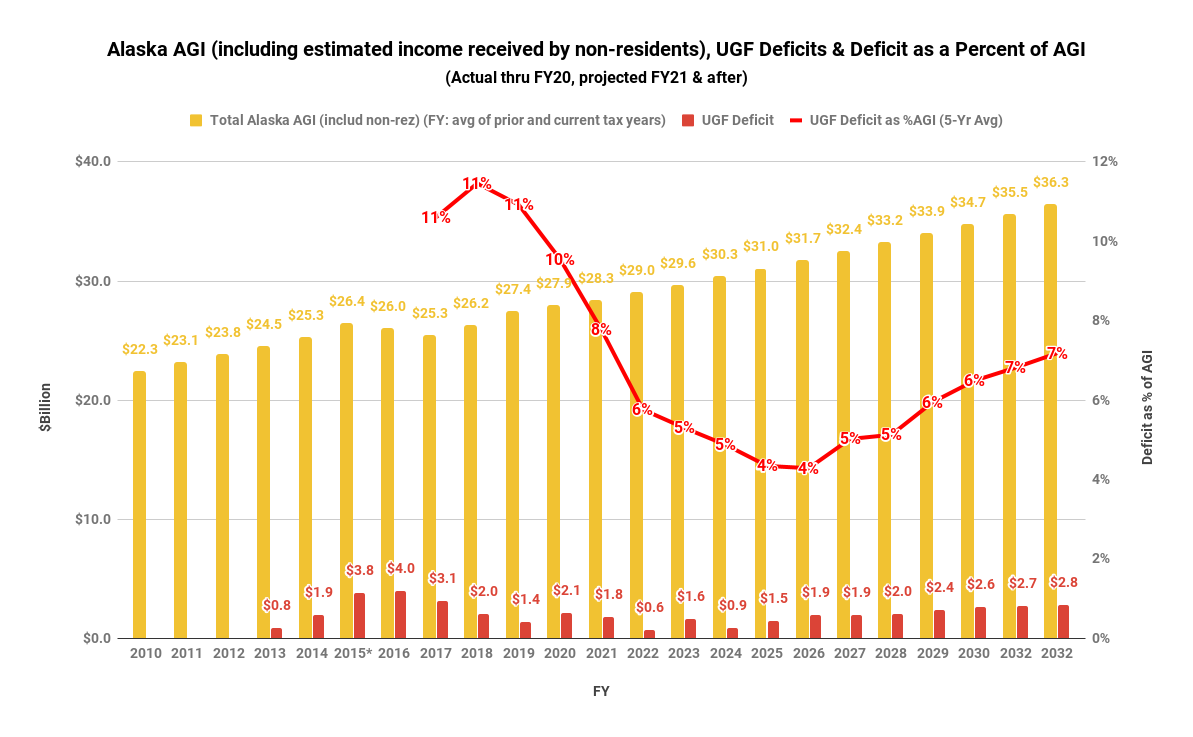
From those base deficit levels, we then calculate their average impact on Alaska’s income by comparing the deficit (red bars in the chart below) to Alaska AGI (yellow bars in the chart below).

We calculate Alaska AGI largely based on Internal Revenue Service (IRS) statistics. Historical statistics for Alaska’s share of federal AGI are available here; the most recent available is for tax year 2020. We project Alaska’s share of federal AGI for tax year 2021 and beyond by increasing each year’s level from the prior year by 2.3%, the average percentage increase in those numbers from tax year 2010 through 2020.
Because of timing differences between the IRS tax year (which is based on the calendar year) and the Alaska fiscal year (which runs from July 1 through June 30), we calculate each fiscal year’s AGI by averaging the tax year AGI from the previous and current years.
The yellow bars also include Alaska-sourced income attributable to non-residents, which can be tapped as well to provide revenue to the state. To calculate the amount, we adjust the fiscal year AGI by 7%, the amount of additional Alaska-sourced income that ISER estimated in its 2016 study is received by non-residents.
To smooth the impact, we use the rolling 5-year average of the size of the deficit expressed as a percent of Alaska AGI (red line in the chart above).
As the chart shows, due to the extended period of spending discipline we discuss above, the size of Alaska’s deficits as a percent of AGI, calculated on a rolling 5-year average, is projected to fall from a high of 11% in the mid- and late-2010s to 5% by FY2024 and 4% in FY2025 and 2026. Due to rising deficits, however, the percentage is projected to increase from those lows back to 7% by the end of the current 10-year period.
The overall average during the period from FY2024 through FY2032 is around 6%.
How we use the results to evaluate fiscal policies
The fiscal approach used to cover the deficit determines which Alaska families bear the burden and how much.
As a baseline for measuring the impact, we use the flat tax included as Option 1 in the range of alternatives analyzed in the 2021 study for the Legislature by the Institute on Taxation and Economic Policy (ITEP), adjusted to reflect the size of the deficit as a percent of Alaska AGI calculated above.
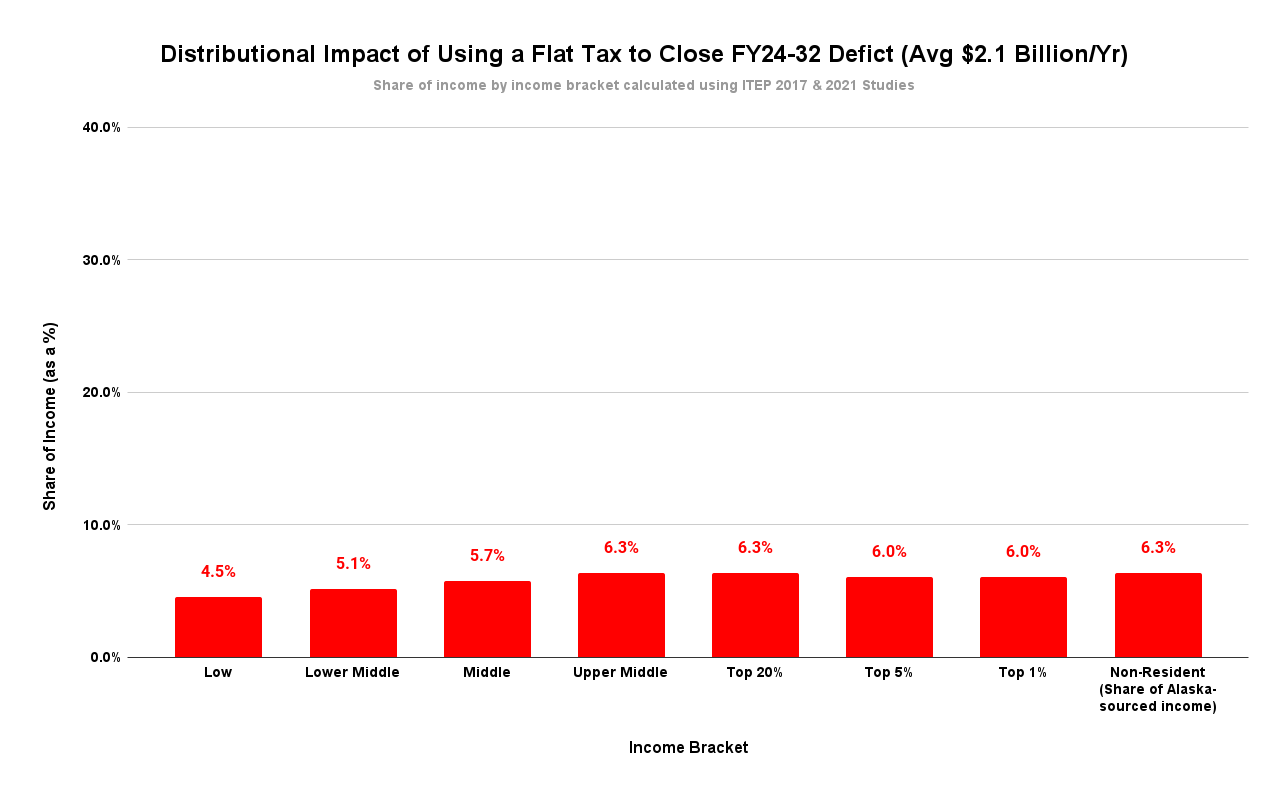
We use that approach as a baseline because it comes the closest of the various options proposed to date to distributing the impact evenly across all Alaska families (and non-residents) – in other words, taking the same share of income from each Alaska and non-resident family. Here is the result of using that approach to recover the currently projected average deficit level for FY2024 through FY2032.

While there are some small deviations, all Alaska families (and non-residents) contribute at or near the average annual deficit of around 6%.
As we’ve explained in previous columns, using cuts to the Permanent Fund Dividend (PFD) to close the deficit – what ISER Professor Matt Berman recently called “the most regressive tax ever proposed” – instead shifts all of the burdens largely to middle and lower-income Alaska families. Unlike other methods, non-residents contribute nothing toward the costs.
While the average effective tax rate would remain at the same 6% of AGI, the impact on individual Alaska families would vary significantly. While those falling in the low-income bracket would contribute more than 30% of their income, and those in the middle-income bracket more than 10%, those in the top 1% would only contribute 0.8% of their income, and non-residents zero. Here’s the result by income bracket compared to the Option 1 flat tax.

Similar comparisons also can be done for other approaches. While, like PFD cuts, using a sales tax also tilts the burden toward middle and lower-income Alaska families, as a 2017 study for the Legislature by ITEP, as well as a 2017 ISER study co-authored by Dr. Berman, make clear, the differential is much less than for PFD cuts. That is partly because, using sales taxes, a portion of the burden is also absorbed by non-residents.
Using a progressive income tax shifts the burden in the other direction, largely to the top 20% of Alaska families. Like a sales tax, however, a portion of the burden is absorbed also by non-residents, reducing the impact on Alaska’s top 20%.
Covering the deficits by drawing down net savings, as has been done to varying degrees since the deficits first emerged in FY2013, shifts the burden toward another group – future Alaska families. They are burdened by being left with a significantly smaller financial cushion when they subsequently face their own financial challenges than this generation has taken advantage of for itself.
Even covering the deficits through increased oil taxes indirectly impacts a segment of Alaska families. If the tax results in decreased activity in Alaska’s oil fields, those whose jobs or income are tied to that activity bear a portion of the burden through reduced income. Like most of the other options, the impact is not distributed proportionately across all income brackets.
There is no escaping Alaska families bearing some of the burden created by the state’s ongoing deficits. As we explain above, even if the entire deficit is closed by increasing oil taxes, some Alaska families still will suffer some fallout.
But in all of the cases other than a flat tax, some Alaska families will bear more of the burden than others. Government fiscal policy will result in winners and losers, limiting the impact of the deficits on some Alaska families while disproportionately burdening others.
By using the impact of the deficit on average Alaska AGI as a baseline, we are able to identify which are favored and which are disproportionately burdened under each approach. It’s a tool that others – particularly OMB and LFD – should use as well to evaluate the impact of the fiscal policies they are asked to evaluate on Alaska families.
Brad Keithley is the Managing Director of Alaskans for Sustainable Budgets, a project focused on developing and advocating for economically robust and durable state fiscal policies. You can follow the work of the project on its website, at @AK4SB on Twitter, on its Facebook page or by subscribing to its weekly podcast on Substack.


