As we wait for the results of the state level elections to become clearer, this week we check in on how FY23 is going from a fiscal perspective. Four months in, a little over a third of FY23 is in the books. While that leaves a lot of room for conditions to change over the remaining months, it’s a useful vantage point from which to spot any trends.
Because the percent of market value (POMV) draw, the amount of the Permanent Fund Dividend (PFD) and, thus, the portion of the draw remaining for government are fixed (subject to later supplementals), the focus of this discussion will be on traditional revenues, largely oil.
Oil revenues are driven by two factors, price and production levels.
While most of the attention normally is paid to price, we start with production levels because the production curve – the distribution of production over the year – is developing somewhat differently this year than last. It’s not that overall FY23 production levels seem off track; they don’t (yet). But they are starting the year on a different path than the prior year production curve suggested they would and that has some impact – albeit, slight to this point – on revenue projections.
The reason changes in the production curve have some impact on revenues is because oil revenues are the product of monthly price times production. If the actual and projected production profile develops differently than forecast, revenues also will come in differently than anticipated. That is the case thus far with Fiscal Year 2023 (FY23).
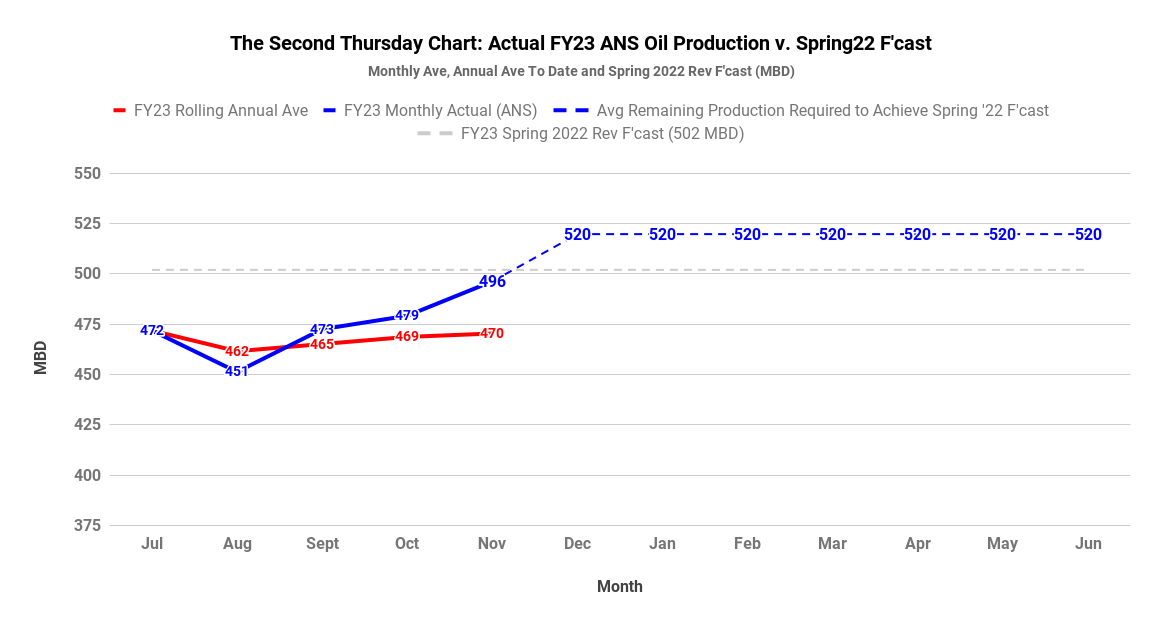
We track the production levels reported by the Department of Revenue weekly in charts posted on our Facebook, Twitter and LinkedIn pages each Thursday. Here is the latest.

The dashed blue line is this year (FY23)’s projected production profile, stated in thousands of barrels per day (MBD) and distributed by month based on last year (FY22)’s production curve. The solid blue line is this year (FY23)’s actual production curve thus far. The dashed red line is the rolling average of this year’s total projected production, again stated in MBD. The solid red line is the actual rolling average of this year’s production curve thus far.
As the chart shows, this year’s production levels started extraordinarily strong compared to the FY22 baseline. Because prices also were higher that month than the levels projected in the Department of Revenue’s (DOR) Spring 2022 Revenue Forecast (Spring Revenue Forecast), the combination resulted in a significantly strong start to revenues.
After starting strong, however, production levels faded in August and have been running below the projected profile since. The result is that, at least as of this week, the rolling average of this year’s total projected production is about 14 MBD (or 3%) below the level anticipated based on last year’s production curve. Understandably, that has a moderating effect on overall revenue levels.
A second chart (also published on Thursdays) shows why, even though current production levels are lagging, we aren’t worried about the ultimate, annual overall production level (yet). Making up the lag only requires averaging about 520 MBD – or only about 5% above current levels – the remainder of the year. Given current field activities, that seems a reasonable assumption at this point.

But, offsetting the results from July, pushing higher production levels deeper into the back end of the year will shift a higher share of revenues to periods when prices are projected to be lower.
Turning to oil prices, here is the FY23 outlook based on prices realized to date and the current futures market, taken from our daily, “The 8:30am Chart” as of Thursday of this week.

As with our daily chart, the numbers in the solid maroon line are the prices realized to date – and those in the dashed maroon line are those projected for the remainder of the year based on the current oil futures market – for Alaska North Slope (ANS) crude. The current projected FY23 arithmetic average (unweighted for production) is $93 per barrel (/b).
Several other prices are included for reference. The dashed green line (at $101/b) is the overall FY23 price projected in the Spring Revenue Forecast. The dashed red line are the actual prices realized to date – and projected for the remainder of the year – reported for spot Brent crude in the federal Energy Information Administration’s most recent Short Term Energy Outlook.
The dashed blue line are the actual prices realized to date reported in DOR’s daily summary of oil prices – and the projected prices for the remainder of the year taken from the futures market – for Brent crude. And the dashed gold line are the actual prices realized to date reported in DOR’s daily summary of oil prices – and the projected prices for the remainder of the year taken from the futures market – for West Texas Intermediate (WTI) crude.
The maroon bars at the bottom are the difference between the ANS price projected in the most recent Spring Revenue Forecast (the green dashed line) and the ANS prices for the year we project as reflected in the maroon lines. The current projected FY23 arithmetic average (unweighted for production) difference between the two is $8/b.
So, what do these production and price levels – as realized and projected at the four month mark – suggest for overall FY23 revenues?
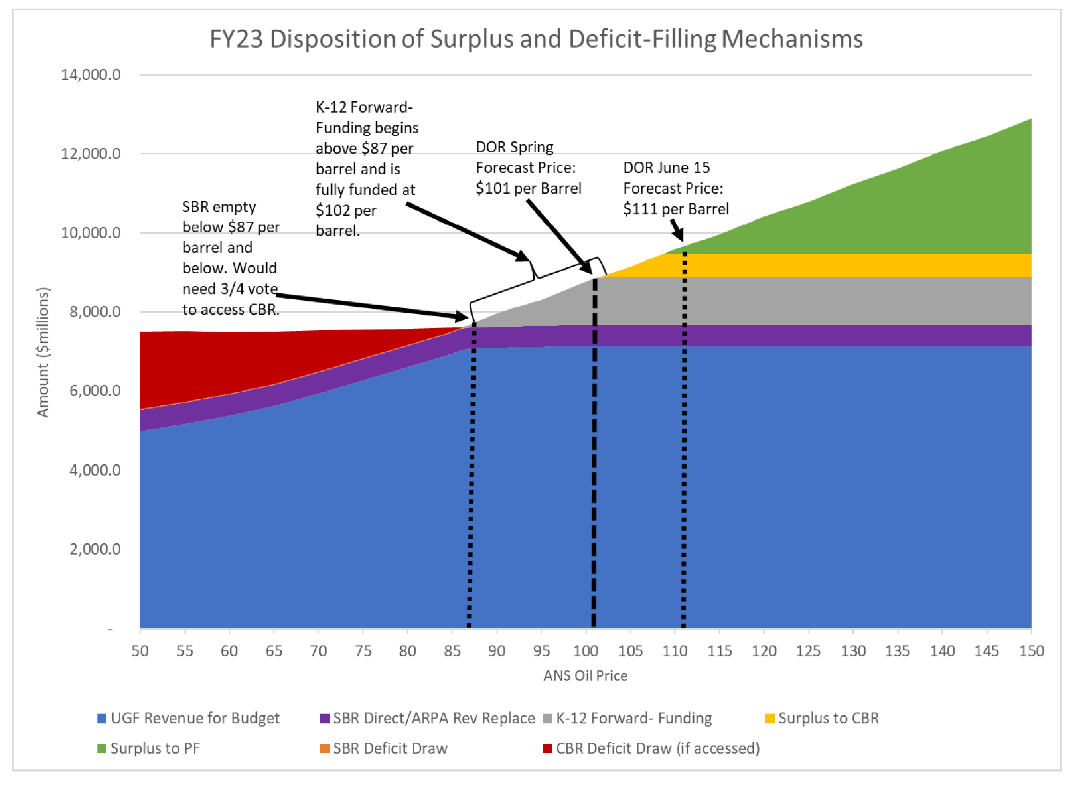
To help put that in context it’s useful first to refer back to an earlier chart published by the Legislative Finance Division (LegFin) in July, at the end of the last legislative session.

In that chart LegFin broke the FY23 budget down into various tranches.
The first tranche (blue plus purple) is the revenue level necessary to balance the budget without requiring a vote to access the Constitutional Budget Reserve (CBR). The second (gray) is that necessary to forward fund FY24 K-12 at the level established by the Legislature in the FY23 budget. The third (yellow) is the amount, if achieved, to be deposited into the CBR. The fourth (green) is the amount, if achieved, to be deposited directly into the Permanent Fund.
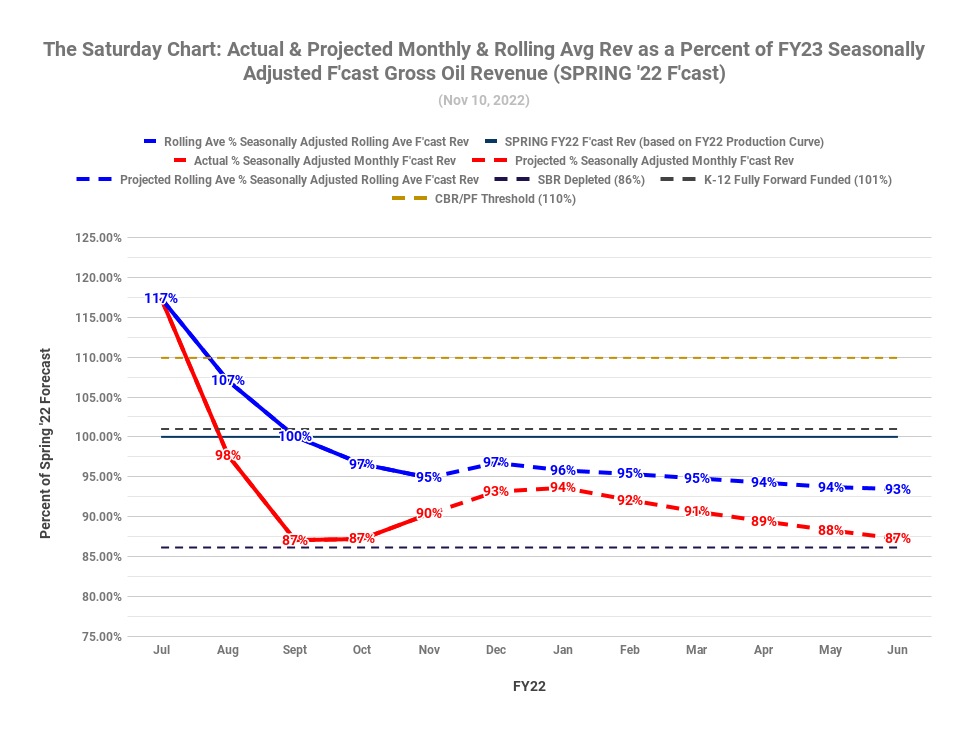
Each week on Saturday’s we combine production and price levels into a chart (“The Saturday Chart”) that takes a look at where current and projected FY23 revenues stand in the context of those tranches.
Reflecting the tranches, we include as part of the baseline on that chart dashed lines that correspond to the revenue levels at which: 1) a vote would be required to access the CBR to balance the FY 24 budget (purple), 2) FY24 K-12 is fully forward funded as set by the Legislature in the FY23 budget (dark gray), and 3) additional revenues are to be deposited into the CBR (dark yellow). The 100% line is the level of revenues projected in the Spring Revenue Forecast.

Within that framework we then calculate the monthly gross oil revenues (price times production) for current and past months (red solid line) and projections of the same amount for the remainder of the year (red dashed line) based on the current futures market (from our daily “8:30 am Charts”) and projected production volumes (from our Thursday charts).
The blue solid line reflects the rolling average of gross oil revenues to date. The dashed blue line reflects projections of the same amount for the remainder of the year.
What that chart shows is that, based on the results to date and projections taken from the futures market and revised production profile, while FY23 revenues are on track to finish significantly (7%) below those projected in the Spring Revenue Forecast, they are still at a point where they will provide roughly 50% of the K-12 forward funding contemplated by the Legislature and are well above the point at which the Legislature would be required to consider a CBR deficit draw next spring.
Of course, because we are only four months in, things can change dramatically by the end of the fiscal year next June. The situation could become more difficult if prices drop further below the levels projected in the Spring Revenue Forecast or production levels don’t recover as anticipated. On the other hand, as demonstrated by the July results, strong price or production levels could improve the situation significantly.
On the current track, however, while current and projected price levels are less than those projected in the Spring Revenue Forecast, they are not at a level which creates a need for a CBR draw and remain at a level which will result in some forward funding toward the FY24 K-12 appropriation.
That’s not perfect, but it’s not as dire as some have suggested.
Brad Keithley is the Managing Director of Alaskans for Sustainable Budgets, a project focused on developing and advocating for economically robust and durable state fiscal policies. You can follow the work of the project on its website, at @AK4SB on Twitter, on its Facebook page or by subscribing to its weekly podcast on Substack.


Hi Brad, PFund investment consultant CEO Greg Allen of Callan Assoc said in annual APFC trustee meeting that the 5% POMV cap was eluded by overvaluing MV with inclusion of ‘unrealized gains’ and under estimation of inflation rate. His figure was that take was 6.5%, that is 20% over cap. However he seemed to be pointing at the varieties of accounting methods. APFC,9/30/2022, reports Principal-58.3billion, ERA Uncommitted-$3.7billion=$62B. ( ERA Committed FY24 POMV $3.5B =Unrealized Gains $1.4B=Inflation Proofing $3.7B= Total of $12.3B). Rate of Return fytd (year to date) 2023 minus 3.82% I am puzzled that this page says Value Added… Read more »