Earlier this month, the Senate Finance Committee introduced Senate Bill (SB) 274, “An Act relating to the computation of the amount available for appropriation from the Alaska permanent fund.”
The purpose of the bill seems straightforward. It amends AS 37.13.140(b), the statute that calculates the annual percentage of market value (POMV) draw from the Permanent Fund, by reducing the percentage from the current 5% to 4.5% on a phased schedule beginning with Fiscal Year (FY) 2029. The bill would begin by reducing the limit to 4.9% in that year, and then by an additional 0.1% in each subsequent year, until it reached 4.5% effective as of FY2033, where it would remain thereafter.
The reductions are in line with the recommendations of some who, in reviewing the Alaska Permanent Fund Corporation’s (APFC) investment performance, express concern that the APFC can continue to generate the returns needed to keep up with the 5% draws.
A slide in a recent presentation to the House and Senate Finance Committees by the APFC’s consultant, Callan Associates, highlights the concern. On that slide, Callan looks at the real (after-inflation) returns generated by the APFC over rolling 5-year averages over the past 30 years.

As the slide itself admits (in the second column from the right), the APFC has failed to achieve a 5% real return in 14 of the last 31 rolling 5-year periods (45%). That percentage is approximately the same when looked at over the last five and ten years as well.
But while reducing the draw level to 4.5% slightly improves the results, it hardly eliminates the concern. Even at a 4.5% draw rate, the APFC has still failed to achieve the target in 11 of the last 31 (35%) rolling 5-year periods. More recently, the results have continued to worsen. Because of deficiencies in FY2023 and FY2024, the APFC has failed to achieve the target in two of the last five rolling 5-year periods (40%).
These results have led some to suggest even lower numbers. In a recent column, for example, former Representative Bart LeBon and current Lt. Governor candidate Josh Church (on a ticket with former Anchorage Mayor Dave Bronson) suggest that the draw rate should be 4.25%. In another recent column, former Senator Joe Paskavan suggests 3%.
But looking at Callan’s chart, even those lower numbers are problematic. Over the five years from FY2008 through FY2013, for example, the rolling 5-year average return never topped even 3%. Had a 5-, 4.5-, 4.25- or even 3% draw rate been in effect during those periods, the Legislature would have either: (a) completely drained the Permanent Fund account from which the draws are made, leading to no draws for a time, or (b) if the two Permanent Fund accounts had been merged, as some have proposed, started draining the Permanent Fund corpus – in essence, taking money from future generations – to maintain the flow of “free money” for the current generation.
As we have explained in a previous column, we have come to agree that the solution to this situation is to provide that the draw rate in any given year shall be the lower of either the rate set by the statute (e.g., the current 5%) or the actual average real return rate achieved by the APFC over the 5-year period on which the draw is being based.
Looking at the Callan chart, for example, the actual average real rate achieved by the APFC over the 5 years ending on June 30, 2023, was 4.05%; over the 5 years ending on June 30, 2024, it was 4.09%. Under the “lower of” approach, the draws based on those periods would have been limited to those rates.
But as important as we have come to believe it is, on the downside, to limit the draw rates to those levels actually achieved, we believe it is equally important to have a higher, what some would call an “aspirational” number on the upside.
As we have explained in previous columns, the APFC could be doing better – indeed, much better – in terms of the returns it is achieving than it has been, especially in the recent past.
In the following chart, we compare the average real rates of return achieved by the APFC on a rolling 5-year period (in red) to the average real rates of return achieved on a rolling 5-year period over the same periods by State Street’s SPDR S&P 500 Exchange Traded Fund (ETF) Trust (exchange name: SPY), the oldest of the S&P 500 ETFs (in blue). At the end of the period, we also compare both to the average real rates of return achieved by the APFC’s “Passive Index” benchmark, which the APFC only began publishing in FY2017 (the dashed line). For reference, we include a line (in green) which reflects the 5% target rate on which the Legislature’s POMV draw is currently based.

While the same as for the APFC’s actual results, there are times over the 30 years during which SPY’s results fall below the 5% target return level. But on a 5-year rolling average over the entire period, especially since FY2013, SPY’s results have significantly outpaced those of the APFC.
Comparing apples to apples, for example, the APFC has produced an average real return over the rolling 5-year periods from 1998 forward of 5.30%, with a median of 5.06%. On the other hand, over the same rolling 5-year periods, SPY has produced an average real return of 7.42% and a median of 8.44%, levels that are, respectively, more than 40% and 60% higher than those achieved by the APFC.
The disparity since FY2013 is even greater. While the APFC has produced an average real return of 6.08% over rolling 5-year periods since that time, with a median of 5.21%, SPY has produced an average real return of 10.89% over the same rolling 5-year periods, with a median of 10.51%, respectively nearly 80% and more than 100% higher than those achieved by the APFC.
As the chart shows, although the APFC has published its “Passive Index” Benchmark only for a short time (since FY2017), even the real returns included in the Benchmark have outstripped the APFC’s own actual results over the period.
The point these charts help make is the same one we have made in previous columns: that there is significant upside potential for the Permanent Fund that the PFC has failed to realize.
Setting the POMV draw at a fixed 4.5% return, as proposed by SB 274, would materially impair both the APFC’s incentive to strive for higher returns and, in its oversight role, the Legislature’s incentive to push for better APFC performance. If the POMV draw is fixed at that level regardless, both the APFC and the Legislature will have achieved their maximum near-term goals if the APFC merely meets that performance level.
As a result, instead of setting the POMV target at 4.5%, we believe the POMV draw rate should continue at 5%, or even higher, subject to reductions in years when the rolling 5-year average does not reach the target.
By adopting those downside and upside parameters, the state will be protected when the actual average real return rate achieved by the APFC over the 5-year period on which the draw is being based is less than the target amount, and rewarded when, as the SPY and other measures indicate is readily achievable, the APFC realizes return levels nearer or at the target. By establishing a reward for better performance, both the APFC and the Legislature will be incentivized to continue pushing for return levels closer to the PFC’s optimum potential, rather than settling for continued, middling return levels.
Providing the flexibility to realize the benefits of higher return levels is also important from the perspective of the Permanent Fund Dividend (PFD).
While as with any preferred dividend, the PFD is supposed to be calculated under current law without regard to the level of the POMV draw in any given year, in actual practice over the last ten years, it has become based instead on what’s “left over” from the POMV draw when all of the state’s other alleged “needs of the day” are met.
Reducing the POMV draw to 4.5% makes things worse.
In the following chart, we track what the split between the shares of the POMV draw used to pay for government services (i.e., as a substitute for taxes) and as PFD distributions have been since FY2019 at a 5% POMV, compared to what they would have been had the POMV draw been 4.5%, with the same amount used to substitute for taxes.
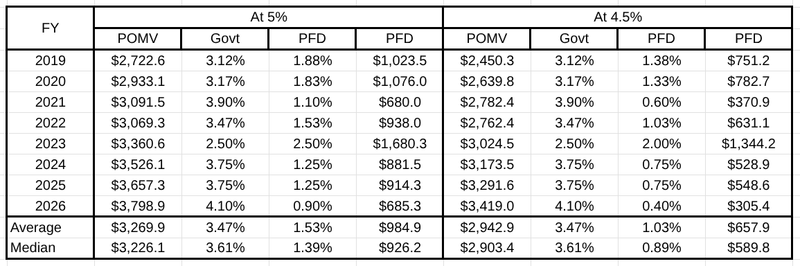
The average amount available for distributions as PFDs would have been 33% less over the period.
More importantly, limiting the POMV draw to 4.5% would have reduced the PFD to less than half of the amount paid in FY2026, the most recent year, and one that likely serves as a template for future years.
By setting the POMV at the lower of the actual rate achieved over the relevant rolling 5-year period or 5% (or even 6%, the average rolling rate actually achieved by the APFC since FY2013), the Legislature would preserve the ability to maintain a “meaningful” PFD when the APFC performs at nearer-to-market levels. In doing so, it would both incentivize the APFC to perform better and for the Legislature to exercise greater oversight when the APFC fails to do so.
By tying the PFD to the result, the approach also would increase regular public scrutiny of the APFC, something that former Governor Jay Hammond thought important and seems relevant again at a time that the APFC is spending nearly $1 billion annually – significantly more than is being distributed as PFDs – on consultant and management fees.
Brad Keithley is the Managing Director of Alaskans for Sustainable Budgets, a project focused on developing and advocating for economically robust and durable state fiscal policies. You can follow the work of the project on its website, at @AK4SB on Twitter, on its Facebook page or by subscribing to its weekly podcast on Substack.