On its website, the Permanent Fund Corporation (PFC) lists three “Strategic Performance Benchmarks [that] are an integral part of our best in class portfolio management and allow for the evaluation of asset class performance in relation to passive and peer results.”
The first one listed is the PFC’s own, self-created “Passive Index Benchmark,” which it describes as “a blend of passive indices reflective of a traditional portfolio consisting of public equities, fixed income, and real estate investments.”
The PFC also describes how the benchmark is to be applied: “Outperformance of the Total Fund versus this Passive Index Benchmark is representative of the value-added by APFC staff in generating higher returns through active asset allocation and portfolio management.”
The unspoken corollary to that application is equally true: Underperformance of the Total Fund versus the Passive Index Benchmark is representative of the value-subtracted by the APFC staff in generating lower returns through active asset allocation and portfolio management.
Monthly, the PFC publishes a performance report that shows the Total Fund return it has achieved over various periods compared to its benchmarks, including its Passive Index Benchmark. Quarterly, the PFC also publishes a report detailing the management and performance fees it incurs in the course of its active asset allocation and portfolio management.
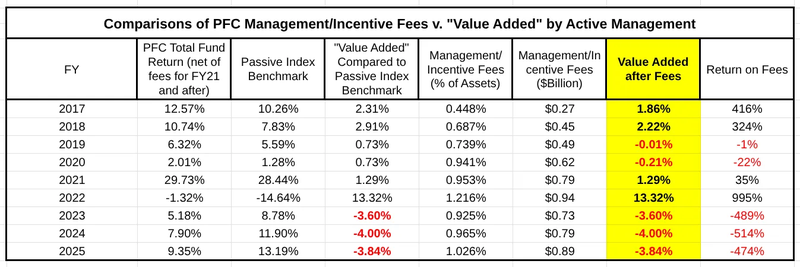
Here is a chart comparing the Total Fund returns and Passive Index Benchmark, as well as the management and performance fees incurred by the PFC, for each fiscal year since Fiscal Year (FY) 2017, the first year for which it published its Passive Index Benchmark, and information regarding the fees incurred by the PFC.

The numbers in the first substantive column (“PFC Total Fund Return (net of fees for FY2021 and after)”) reflect the performance of the Total Fund for each fiscal year. Those in the second column (“Passive Index Benchmark”) reflect the numbers reported by the PFC for the Passive Index Benchmark for the same year.
The numbers in the third column (“‘Value Added’” Compared to Passive Index Benchmark”) are the difference between the performance of the Total Fund and the Passive Index Benchmark for each fiscal year. To use the terminology of the PFC, they are the measure of the “value-added,” or the corollary, the value-subtracted, for that year by the “APFC staff … through active asset allocation and portfolio management.”
The numbers in the fourth column (“Management/Incentive Fees (% of Assets)”) are the management and incentive fees incurred by the PFC in its “active management” of the Fund, expressed as a percent of the funds under management. According to the PFC, the Total Fund return is net of those fees for FY2021 and after. They are not for prior years. The numbers in the fifth column (“Management/Incentive Fees ($Billion)”) represent the amount of fees in dollars (in billions) for each year.
The numbers in the sixth column (“Value Added after Fees”) reflect the value added (or subtracted) after the fees, expressed as a return on assets. Because the Total Fund return is net of those fees for FY21 and after, the numbers in the sixth column for those years are the same as those in the third column. For prior years, the numbers in the sixth column are the net of those in the third minus those in the fourth.
The final column (“Return on Fees”) treats the fees paid as an investment by the PFC and calculates the return realized on that investment. It is the result of dividing the Value Added after Fees (the sixth column) by the fees paid to produce the return on the fees paid (invested) in that year.
The results from the analysis are clear. Using the benchmark in the manner described by the PFC, the Total Fund outperformed the Passive Index Benchmark, before fees, consistently from FY2017 through FY2022. In four of those years (FY2017 & 2018, and again in FY2021 & 2022), the Total Fund outperformed the Passive Index Benchmark after fees as well. In two of those years (FY2019 and 2020), the Total Fund underperformed the Passive Index Benchmark after fees, but not by a significant amount.
However, the results have been significantly different during the post-COVID era (i.e., over the last three years). Over that period, the Total Fund has consistently underperformed the PFC’s own, self-created Passive Index Benchmark, even before fees. Using the corollary of the PFC’s statement on its website, through its active asset allocation and portfolio management, the PFC has actually subtracted from, i.e., regressed, the value of the Permanent Fund over that period.
Put another way, the value of the Permanent Fund would be higher over the period if, rather than actively managing the Fund, the PFC had simply put it on autopilot, utilizing the investment approach reflected in its Passive Index Benchmark.
Moreover, the amounts spent on fees on that regressive effort have been significant. Over the three years from FY2023 through FY2025, the PFC spent approximately $2.4 billion on fees, an amount equal to roughly 3% of the total fund balance as of the end of FY2025. On average, that equals approximately $800 million annually over the period, or nearly 1% of assets under management.
As demonstrated on the following chart, which we have explained in previous columns, that compares to comparable payments over the same period by the Norwegian Government Pension Fund Global (commonly referred to as the Norwegian sovereign wealth fund), equal to only 0.043% of assets under management, or nearly 23 times less than the percentage being paid by the PFC.

Why is the PFC spending so much and yet producing regressive results, even against its own self-created benchmark?
In a recent comment, Brian Fechter, a former deputy commissioner for the Department of Revenue and chief budget analyst for the Office of Management and Budget, and in those capacities, a long-time observer of the PFC, put the PFC’s investment approach in overall perspective:
There are two ends of the [investment approach]spectrum. There’s Yale’s endowment which is super actively managed – their fees are something like 1.5% but they’ve averaged 3% excess returns long term. Super well connected people. Very highly compensated. But able to get in on the ground floor of a lot of startup activities. Then there’s Nevada and Idaho who have one guy running the show (making sub $200,000) and just puts it in an index at a low expense ratio and calls it good. APFC seems to be in the middle in the worst way. They pay their people way too much, their fees are too high, and they’re not able to generate any excess returns for what they’re paying management companies.
Fechter’s comment echoes the general observation made previously by investment icon Warren Buffett when explaining his 90/10 investment approach. As Buffett said in his famous 2013 letter to shareholders:
Both individuals and institutions will constantly be urged to be active by those who profit from giving advice or effecting transactions. The resulting frictional costs can be huge …. So ignore the chatter, keep your costs minimal. [Instead,] put 10% of the cash in short-term government bonds and 90% in a very low-cost S&P 500 index fund. (I suggest Vanguard’s.) I believe the … long-term results from this policy will likely be better than those achieved by most investors—whether pension funds, institutions, or individuals—who hire high-fee managers.
As we’ve explained in previous columns, Buffett’s prediction – that his 90/10 approach “will likely be better than those achieved by most investors—whether pension funds, institutions, or individuals—who hire high-fee managers” – has certainly been the case over the last decade when applied to the PFC.
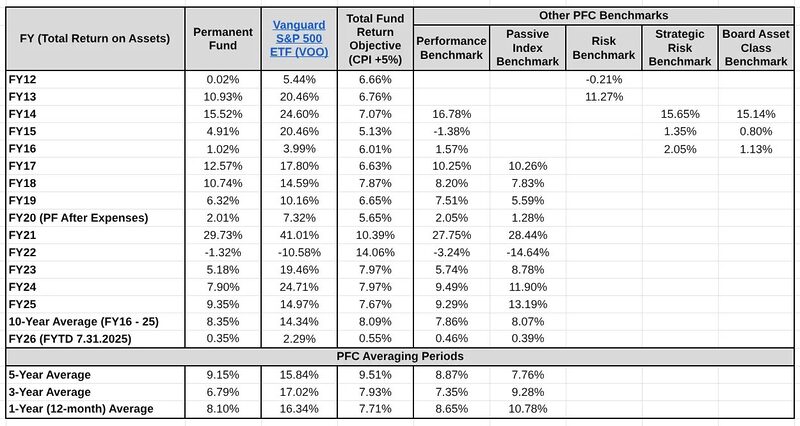
Our most recent analysis of the PFC’s performance, based on its “Monthly Performance Report” as of July 31, 2025, confirms this result. As the following chart shows, in every year except one since FY2012, returns using the Buffett-recommended Vanguard S&P 500 index fund (third column, “Vanguard S&P 500 ETF (VOO)) have exceeded those achieved by the PFC.
Looking at the bottom of the chart, this remains the case currently, as indicated by the 5-, 3-, and 1-year rolling averages, as well as for FY2026 to date.

Applying the PFC’s own test for the success of its “active asset allocation and portfolio management” approach against Buffett’s passive index approach – does the Total Fund outperform the benchmark – demonstrates that the PFC’s high-cost approach has been a consistent failure.
In short, the PFC’s approach is costing a lot, and yet it is performing worse since COVID than the PFC’s own, self-created Passive Index Benchmark, and even worse than Buffett’s 90/10 approach for a much longer period. Since the PFC’s Board isn’t, the Governor – who appoints the members of the PFC’s Board – and the Legislature – who looks to PFC earnings for a substantial portion of state revenues – should be asking whether it’s time, indeed, past time, for a change in the PFC’s investment approach and also its Board.
Brad Keithley is the Managing Director of Alaskans for Sustainable Budgets, a project focused on developing and advocating for economically robust and durable state fiscal policies. You can follow the work of the project on its website, at @AK4SB on Twitter, on its Facebook page or by subscribing to its weekly podcast on Substack.


Hi Brad, Active management tends to track with broader indexes as you’ve noted above, but the value in these strategies isn’t in tracking or alpha or even beta. The value is in the risk adjust return and in draw-down situations, which tend to be infrequent and may even not show up in a 10-year MA. Quoting buffet – Rule no. 1 – Never lose money, Rule no. 2 – Never forget rule number 1. I’m not in the industry and have no ties. Just an engineer with a spreadsheet. It would be interesting to see what value PFC is getting… Read more »
You can take a look at the Permanent Funds various ratios in their quarterly board packets. Looks like the latest one is from March and they reported a sharp ratio of negative 0.1. The Sharp ratio is a measure of risk adjusted return. A negative Sharpe ratio indicates the fund manager’s returns did not exceed the risk-free rate and potentially lost money during the time frame you’re analyzing. Over long-term, a passive 90-10 portfolio has a sharp ratio of 0.9. Generally, the higher the sharp ratio the better if you’re using it to compare two portfolios. If you look in… Read more »
So this author who has zero career investment experience is supporting his investment argument by quoting another guy with zero career investment experience. Ok, then.
Buffett has zero career investment experience?
In the Buffett quote, line 2, do you mean “fractional”?