Recently, the Department of Revenue (DOR) has been publishing updates (what it labels “notifications”) to their previous official (Spring 2022 Revenue) forecast for “changes in the revenue outlook.”
The updates aren’t intended to be published every month. Instead, “a notification will be sent to legislators and others who have requested to be included on the distribution list,“ only “if the non-POMV [Percent of Market Value] unrestricted revenues are estimated to be 10% more or less than the previous official forecast.”
But despite their intended limited use, DOR already has published three (for June, July and August) since this year’s Spring Forecast, the most recent (dated August 16, 2022, “DOR’s August Notice”) because, based on recent oil futures prices, DOR now estimates FY23 “non-POMV” revenues to be more than 10% below those projected in the Spring Forecast.
Predictably, that notice was picked up by the press and has resulted in at least two stories topped by somewhat doom and gloom headlines: “Alaska budget surplus shrinks with falling oil prices” (Anchorage Daily News, August 18) and “Falling oil prices are already having an impact on Alaska’s revenue forecast” (Alaska Journal of Commerce, August 17).
But we believe both DOR’s revised forecast and the headlines (and stories) are overly pessimistic – at least to this point – and, in fact, both FY23 and FY24 prices and revenues remain well within 5% of those included in the Spring Forecast. This column explains why.
As some readers will be aware, as part of our weekly routine we regularly prepare and publish on our Twitter, Facebook and LinkedIn pages, and through them, on our website, a number of oil price and revenue assessments, incorporating both actual and futures prices.
For example, at (sometimes, plus or minus) 8:30 am each morning (ex-Sunday) we publish what we call, predictably, “The 8:30 a Chart,” combining actual prices to date for the current fiscal year together with the morning’s opening future prices for the remainder of the current fiscal year and the five years beyond.
On Fridays, we roll those into a series of week ending charts reflecting current assessments of both revenues, and using an updated spending forecast reflecting the results of the past legislative session and current inflation expectations, updates of projected budget balances for the period covered by the Dunleavy administration’s most recent 10-year plan.
And on Saturdays, we combine those with our weekly (Thursdays) look at production levels, to analyze the status of forecasted revenues for the current fiscal year.
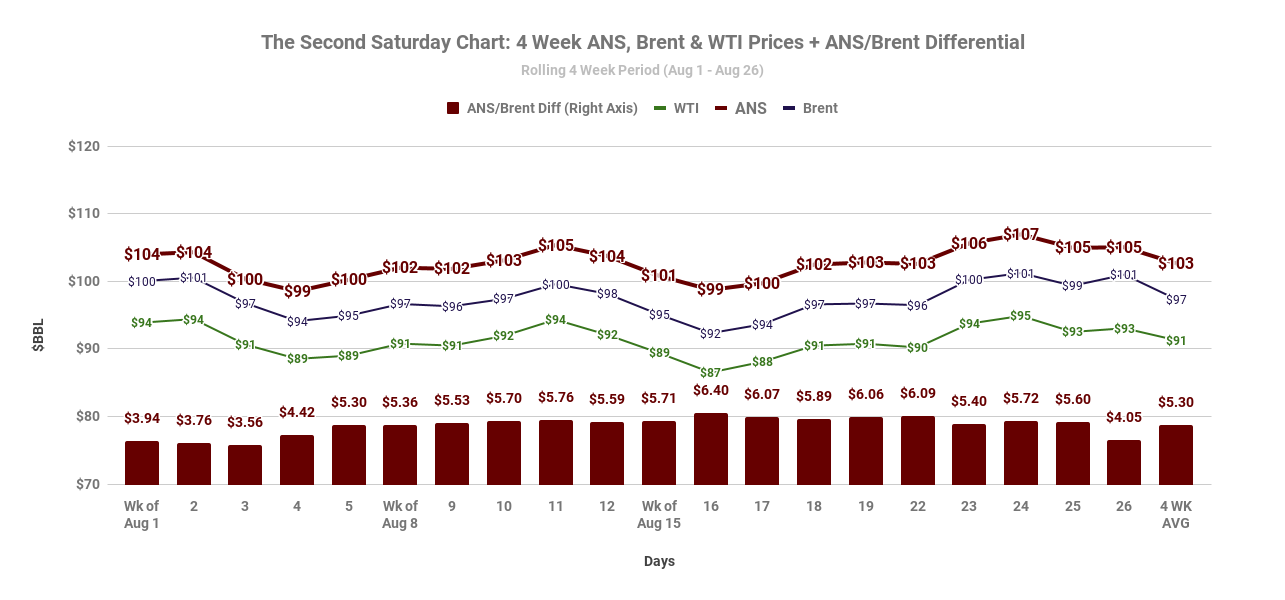
Importantly for purposes of this column, on Saturdays we also analyze in detail the differences over the prior four weeks in the prices reported for Alaska North Slope (ANS), Brent and West Texas Intermediate (WTI), focusing particularly on the price differences between ANS and Brent. Here is the most recent:

As the chart makes clear, over the four week period it covers, ANS (in red) significantly has exceeded the reported prices for both Brent (blue) and WTI (green). The bars at the bottom reflect the daily and, at the far right, average difference between ANS and Brent.
The 4-week differential chart we publish on Saturdays is part of a larger set we maintain that looks at the prices and differentials on a rolling 12-month basis.
While our charts currently are showing slightly lower FY23 prices and, as a consequence, revenues, than those on which the most recent Spring Forecast is based, none are showing the type of drops reflected in DOR’s August notice.
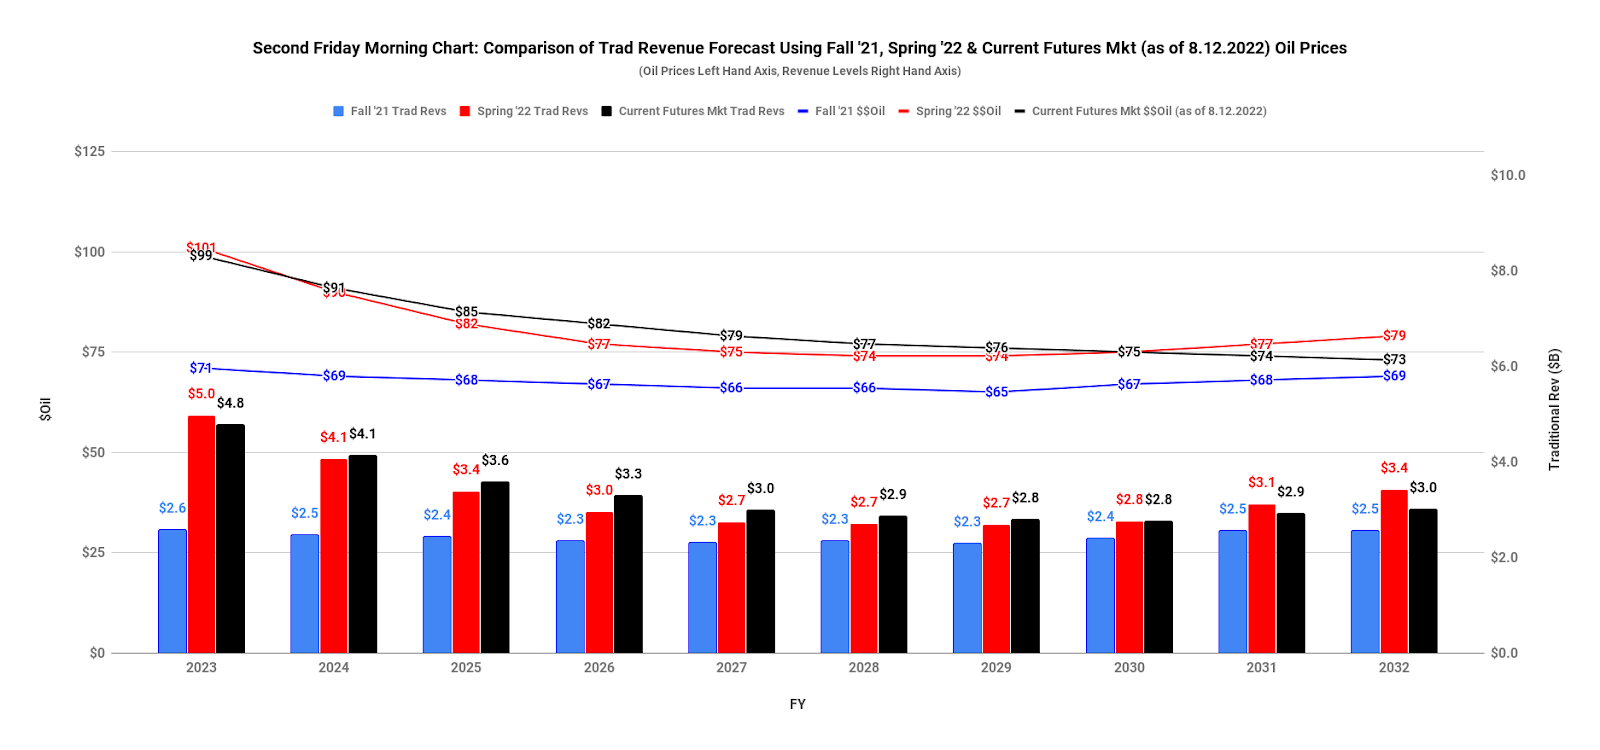
For example, here’s our assessment from Friday, August 12, our equivalent of the August 15th assessment on which DOR’s August Notice is based.

The lines at the top are the projected ANS prices ($/bbl, left axis) included in the Fall 2021 Revenue Sources Book (blue), Spring 2022 Revenue Forecast (red) and from our then-most recent daily assessment of actual, year-to-date FY23 prices plus projected futures (black).
The bars at the bottom are projected “non-POMV unrestricted revenues” ($ Billion, right axis) based on those prices, again included in the Fall 2021 Revenue Sources Book (blue), Spring 2022 Revenue Forecast (red) and from our then-most recent daily assessment based on futures prices (black).
Where DOR saw projected FY23 and FY24 ANS prices per barrel at $94 and $86 in its August 15th Notice, we had them at $99 and $91 in our August 12th Friday Morning Chart. And where DOR saw projected FY23 and FY24 non-POMV unrestricted revenues at $4.3 billion and $3.7 billion, we had them at $4.8 billion and $4.1 billion.
In short, while DOR saw FY23 and FY24 non-POMV unrestricted revenues down from the Spring Forecast by 14.4% and 9.8%, respectively, we saw FY23 down only 4% and FY24 actually up by 0.9%.
What explains the difference?
Largely one thing: how each of us deal with the differential between ANS and Brent in looking at the futures prices.
Because of its relatively small and isolated nature, there is no separate, publicly-traded and reported futures market for ANS. Both DOR’s and our analyses start with the Brent price.
While DOR’s analysis understandably uses the actual ANS price – which automatically incorporates the ANS/Brent differential – when looking at past prices, it uses only the Brent price when looking at futures, ignoring the differential. Its future projections start and stop with the Brent price.
Our analysis of ANS prices, on the other hand, uses both the actual ANS price looking backwards, and adjusts the Brent futures price going forward (up or down) by the most recent 30-day rolling average of the ANS/Brent differential. While it’s reasonable to argue about whether the differential used to adjust the Brent forward curve for ANS-specific projections should be based on the 10-day, 30-day, 90-day, 6-month or even 12-month differential between the prices, in our view, at least, it’s misleading to ignore the differential entirely.
This is especially true since the Russian invasion of Ukraine and, with that, the ban on Russian imports by most Western nations.
As Elwood Brehmer explained in an April article in the Fairbanks News-Miner (“War in Ukraine propels the price of Alaska oil past other benchmarks”):
While the cost of one is most certainly not worth the other, Russia’s invasion of Ukraine is proving to be an indirect windfall for Alaska’s treasury.
Alaska North Slope crude oil traded for $115.14 per barrel on April 14, according to state Department of Revenue officials. That same day, oil indexed to the Brent benchmark sold for an average of $111.70.
A premium of $3.43 per barrel for Alaska oil on a given day may not seem like much initially, but it has been larger in recent weeks and represents a reversal of a longstanding trend. Over time, it adds up. …
The ANS-Brent price difference is largely the result of there simply being less oil — specifically less of the light, sweet crude produced from the North Slope and Russia — available to refineries in Washington and California where most of Alaska’s oil is sent, according to Alaska Department of Revenue researchers and others. Members of the Revenue Department’s economic research group wrote in response to questions about the price difference that West Coast refineries have been working to meet the increased demand for fuel that materializes most summers while also dealing with the lack of Russian crude that has created a tighter supply in the West Coast oil market. …
Last year, West Coast refineries purchased up to 3.5 million barrels of light, sweet oil per month from Russia during the peak of summer. Those refineries purchased more than 5.8 million barrels of Russian oil in total last June [roughly 4.4% of total West Coast supply], according to data from the federal Energy Information Administration.
[Due to the ban imposed on the importation of Russian crude announced on March 8, however, this year they have imported none from Russia.]
“Additionally, Saudi Arabia has increased their posted price premiums relative to Brent and other benchmark crudes. This makes ANS relatively more attractive in instances where ANS is competing with Saudi crude,” they wrote.
Here’s our most recent full, 12-month look at the differential. The prices of ANS (in dark red), Brent (blue) and WTI (green) are reflected in the lines at the top. The extent of the ANS/Brent differential (in $/bbl) are the bars at the bottom. The 12-month, 6-month, 3-month and 30-day averages are the last four bars on the right.

It is true that the ANS differential to Brent has varied up and down over time. But as is clear from the chart, since April 1, when the US and UK bans on the importation of Russian oil effectively started impacting futures prices, the differential has been materially – and almost continuously – positive.
Because there is always a differential one way or the other, we believe that a factor for the differential should always be incorporated somehow into forward projections of ANS prices. In our view, using only the unadjusted Brent price reflects Brent futures, not a complete picture of the projected ANS price.
If the differential is small, as it was in the run up to the Russian invasion of Ukraine, it will have a slight impact on projections of ANS prices and through that, revenues.
But if it is material, either way – as it has been since the Russian invasion – then ignoring it has a distorting impact on projections of ANS prices and revenues.
As we said earlier, it can be debated whether a 10-day, 30-day, 90-day, 6-month or even 12-month average differential provides the most reasonable tool for assessing the differences. And we could see a case, during times like these which are driven by a specific event, for using a short term differential to project near term prices (e.g., using the 30-day average to project prices over the next two fiscal years), then reverting to a long term differential (e.g., the 12-month average) to project prices beyond that.
But even using the current 12-month average differential (~$1.50/bbl) only, FY23 revenues would only have been down 9% since the Spring Forecast instead of the 14% projected in DOR’s August Notice.
DOR is publishing its notices for a reason – to update interested Alaskans on changes in the projected outlook for ANS oil prices and through that, revenues. If DOR is going to do that it also should incorporate a factor for the ANS/Brent differential, at least as an additional data point next to their current method, so that interested Alaskans are exposed to the whole picture, not a half-and-half of past ANS prices and forward Brent-only prices.
Brad Keithley is the Managing Director of Alaskans for Sustainable Budgets, a project focused on developing and advocating for economically robust and durable state fiscal policies. You can follow the work of the project on its website, at @AK4SB on Twitter, on its Facebook page or by subscribing to its weekly podcast on Substack.


I super appreciate this sort of analysis. It’s new, not rote; and I am better educated because of it. Thank you.
Alaska is no longer a major player and therefore our minor market has little or no influence. Didn’t we just get “stuck” with another AIDEA money loss on the foolish notion we can “partner” with industry? Won’t our oil and gas will be developed and sold when the lease holders say it will unless we apply pressure as Governor Murkowski did? Get what revenue you can from our “partners” and be thankful for it.